Mapped: Income Growth in Every U.S. State Since 2010
See visuals like this from many other data creators on our Voronoi app. Download it for free on iOS or Android and discover incredible data-driven charts from a variety of trusted sources.
Key Takeaways
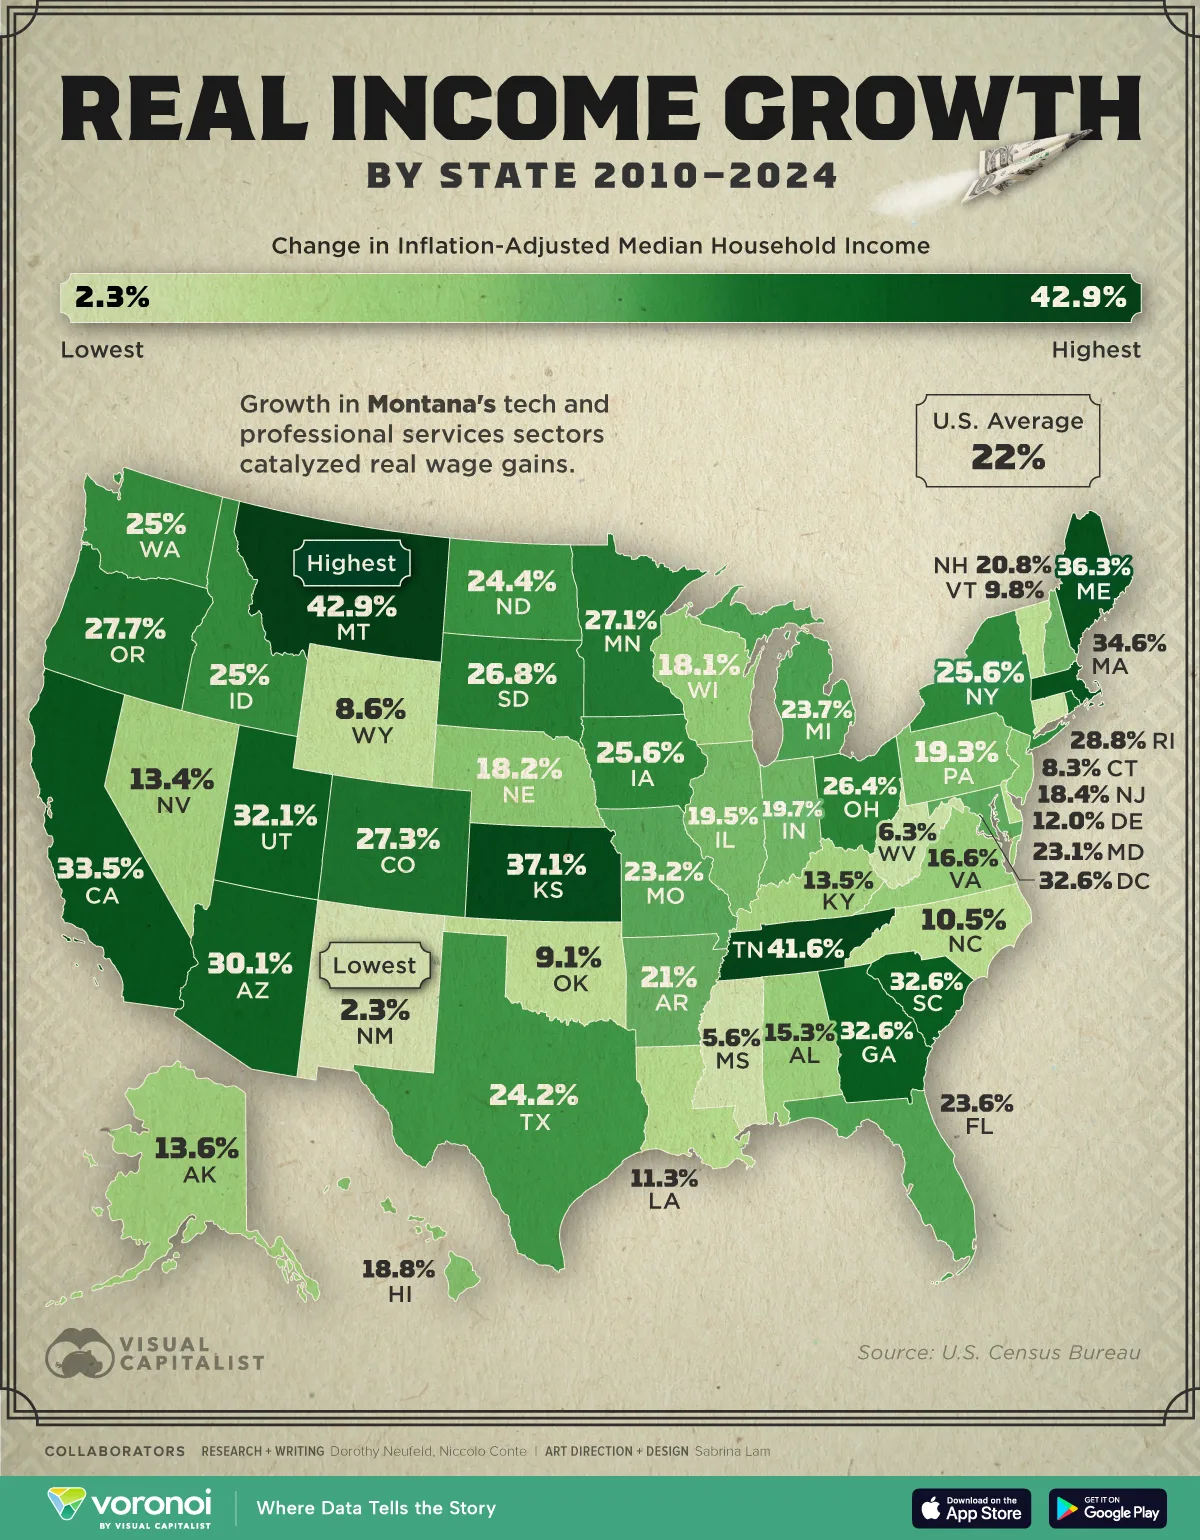
- Montana leads the U.S. with 42.9% growth in real median household income since 2010, nearly double the national average.
- Several Mountain West and Southern states rank among the fastest-growing, including Tennessee and Kansas.
- New Mexico (2.3%) and Mississippi (5.6%) saw the smallest gains over the period.
Since 2010, real household incomes have risen significantly across the U.S., with some states seeing gains of more than 40%.
Montana leads the nation with a 42.9% increase in real median household income over the period, followed by Tennessee and Kansas.
This map shows how much incomes have grown in every U.S. state from 2010 to 2024, based on data from the U.S. Census Bureau.
Where Incomes Have Grown the Most
Montana has seen one of the biggest income turnarounds in America. In 2010, the state ranked seventh-lowest in median household income, but today it sits closer to the middle of the national rankings.
Over that period, real median household income climbed 42.9%, from $57,320 to $81,920.
| Rank | State | Median Income 2010 | Median Income 2024 | Change 2010-2024 |
|---|---|---|---|---|
| 1 | Montana | $57,320 | $81,920 | 42.9% |
| 2 | Tennessee | $53,580 | $75,860 | 41.6% |
| 3 | Kansas | $63,950 | $87,690 | 37.1% |
| 4 | Maine | $66,550 | $90,730 | 36.3% |
| 5 | Massachusetts | $84,610 | $113,900 | 34.6% |
| 6 | California | $75,370 | $100,600 | 33.5% |
| 7 | South Carolina | $57,900 | $76,780 | 32.6% |
| 8 | District of Columbia | $79,050 | $104,800 | 32.6% |
| 9 | Georgia | $61,260 | $81,210 | 32.6% |
| 10 | Utah | $78,730 | $104,000 | 32.1% |
| 11 | Arizona | $65,120 | $84,700 | 30.1% |
| 12 | Rhode Island | $71,680 | $92,290 | 28.8% |
| 13 | Oregon | $70,260 | $89,700 | 27.7% |
| 14 | Colorado | $83,640 | $106,500 | 27.3% |
| 15 | Minnesota | $72,650 | $92,350 | 27.1% |
| 16 | South Dakota | $62,970 | $79,850 | 26.8% |
| 17 | Ohio | $63,710 | $80,520 | 26.4% |
| 18 | New York | $69,120 | $86,830 | 25.6% |
| 19 | Iowa | $68,060 | $85,480 | 25.6% |
| 20 | Washington | $77,980 | $97,500 | 25.0% |
| 21 | Idaho | $65,330 | $81,650 | 25.0% |
| 22 | North Dakota | $70,820 | $88,080 | 24.4% |
| 23 | Texas | $65,630 | $81,490 | 24.2% |
| 24 | Michigan | $64,260 | $79,460 | 23.7% |
| 25 | Florida | $61,190 | $75,630 | 23.6% |
| 26 | Missouri | $63,620 | $78,390 | 23.2% |
| 27 | Maryland | $89,150 | $109,700 | 23.1% |
| 28 | Arkansas | $53,580 | $64,840 | 21.0% |
| 29 | New Hampshire | $92,520 | $111,800 | 20.8% |
| 30 | Indiana | $64,070 | $76,710 | 19.7% |
| 31 | Illinois | $70,440 | $84,210 | 19.5% |
| 32 | Pennsylvania | $67,090 | $80,060 | 19.3% |
| 33 | Hawaii | $82,670 | $98,240 | 18.8% |
| 34 | New Jersey | $87,430 | $103,500 | 18.4% |
| 35 | Nebraska | $72,900 | $86,140 | 18.2% |
| 36 | Wisconsin | $69,910 | $82,560 | 18.1% |
| 37 | Virginia | $83,820 | $97,720 | 16.6% |
| 38 | Alabama | $56,840 | $65,560 | 15.3% |
| 39 | Alaska | $80,320 | $91,260 | 13.6% |
| 40 | Kentucky | $57,070 | $64,790 | 13.5% |
| 41 | Nevada | $71,090 | $80,590 | 13.4% |
| 42 | Delaware | $76,670 | $85,860 | 12.0% |
| 43 | Louisiana | $54,570 | $60,740 | 11.3% |
| 44 | North Carolina | $60,860 | $67,220 | 10.5% |
| 45 | Vermont | $77,660 | $85,260 | 9.8% |
| 46 | Oklahoma | $59,850 | $65,310 | 9.1% |
| 47 | Wyoming | $72,480 | $78,680 | 8.6% |
| 48 | Connecticut | $91,640 | $99,240 | 8.3% |
| 49 | West Virginia | $59,400 | $63,150 | 6.3% |
| 50 | Mississippi | $52,990 | $55,980 | 5.6% |
| 51 | New Mexico | $62,670 | $64,140 | 2.3% |
Several factors have contributed to the surge of real incomes in Montana, including growth in the tech sector, an expanding tourism industry, and tight labor markets driven by an aging population.
Tennessee and Kansas follow next in line, each seeing wage gains exceeding 37%.
Back in 2010, Tennessee had the second-lowest median income of $53,580. Today, it stands above Florida, jumping nine spots to reach $75,860. In Kansas, meanwhile, median incomes are higher than in New York, at $87,690.
Ranking in fifth is Massachusetts, with incomes rising 34.6% to reach $113,900, the highest nationwide.
Looking over to large state economies, California (33.5%) outpaced New York (25.6%) and Texas (24.2%), likely driven by its concentration of tech workers. Florida, driven largely by services and tourism, saw 23.6% growth—slightly above the national average of 22.4%.
Income Growth Laggards
Many of the states with the slowest income growth since 2010 are concentrated in the South, though laggards appear across several regions.
Mississippi (5.6%) and West Virginia (6.3%) saw some of the weakest gains in real median household income over the period, while Oklahoma (9.1%) and Louisiana (11.3%) also recorded relatively modest increases.
Outside the region, New Mexico posted the smallest rise nationwide at just 2.3%.
For many reasons, the geography of income growth in America has been quietly reshaped. As migration, demographics, and economic activity shift, how much Americans earn may increasingly depend on where they live.
Learn More on the Voronoi App 
To learn more about this topic, check out this graphic on the average salary by state in 2025.


