 Click to view this graphic in higher-resolution.
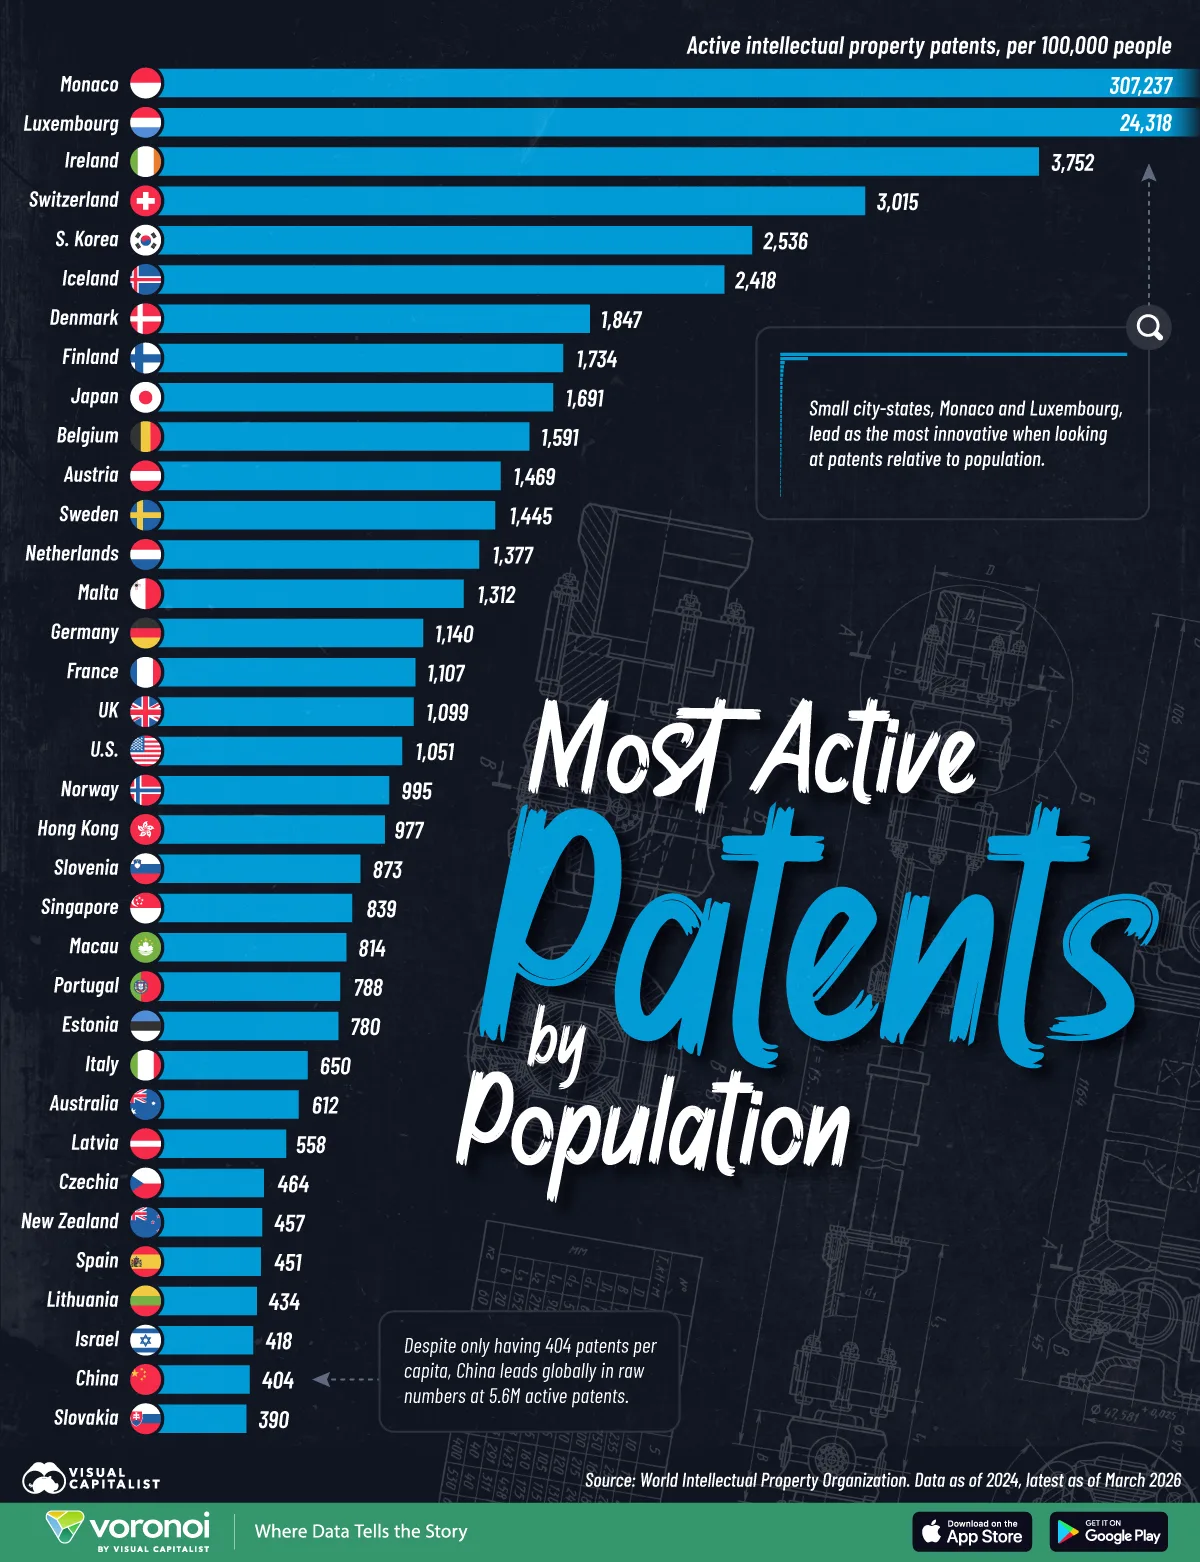
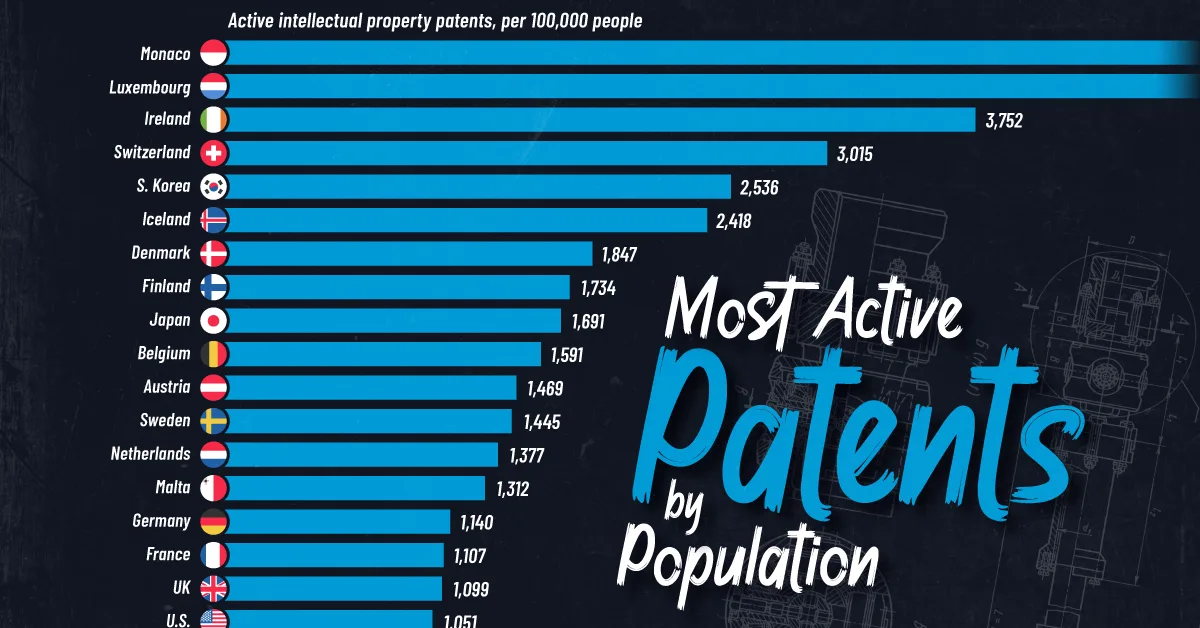
Ranked: Countries With the Most Patents per Capita
See visuals like this from many other data creators on our Voronoi app. Download it for free on iOS or Android and discover incredible data-driven charts from a variety of trusted sources.
Key Takeaways
- Monaco leads by a massive margin with over 307,000 patents per 100,000 people
- Luxembourg ranks second, but trails far behind at 24,318
- South Korea leads major economies, ahead of Japan, the U.S., and China
Monaco has over 300,000 patents per 100,000 people—more than 12 times higher than the next country.
This striking gap highlights how patent activity is often concentrated in small financial hubs rather than large industrial economies.
This chart ranks countries by active patents per 100,000 people, based on 2024 data from the World Intellectual Property Organization.
Active Patents by Country Per Person
Check out the data here:
| Rank | Country | Active Patents per 100,000 People |
|---|---|---|
| 1 |  Monaco Monaco |
307,237 |
| 2 |  Luxembourg Luxembourg |
24,318 |
| 3 |  Ireland Ireland |
3,752 |
| 4 |  Switzerland Switzerland |
3,015 |
| 5 |  South Korea South Korea |
2,536 |
| 6 |  Iceland Iceland |
2,418 |
| 7 |  Denmark Denmark |
1,847 |
| 8 |  Finland Finland |
1,734 |
| 9 |  Japan Japan |
1,691 |
| 10 |  Belgium Belgium |
1,591 |
| 11 |  Austria Austria |
1,469 |
| 12 |  Sweden Sweden |
1,445 |
| 13 |  The Netherlands The Netherlands |
1,377 |
| 14 |  Malta Malta |
1,312 |
| 15 |  Germany Germany |
1,140 |
| 16 |  France France |
1,107 |
| 17 |  United Kingdom United Kingdom |
1,099 |
| 18 |  United States United States |
1,051 |
| 19 |  Norway Norway |
995 |
| 20 |  Hong Kong Hong Kong |
977 |
| 21 |  Slovenia Slovenia |
873 |
| 22 |  Singapore Singapore |
839 |
| 23 |  Macao Macao |
814 |
| 24 |  Portugal Portugal |
788 |
| 25 |  Estonia Estonia |
780 |
| 26 |  Italy Italy |
650 |
| 27 |  Australia Australia |
612 |
| 28 |  Latvia Latvia |
558 |
| 29 |  Czechia Czechia |
464 |
| 30 |  New Zealand New Zealand |
457 |
| 31 |  Spain Spain |
451 |
| 32 |  Lithuania Lithuania |
434 |
| 33 |  Israel Israel |
418 |
| 34 |  China China |
404 |
| 35 |  Slovakia Slovakia |
390 |
| 36 |  Hungary Hungary |
374 |
| 37 |  Croatia Croatia |
349 |
| 38 |  North Macedonia North Macedonia |
302 |
| 39 |  Poland Poland |
296 |
| 40 |  Bulgaria Bulgaria |
207 |
| 41 |  Russia Russia |
169 |
| 42 |  South Africa South Africa |
165 |
| 43 |  Romania Romania |
144 |
| 44 |  Serbia Serbia |
141 |
| 45 |  Malaysia Malaysia |
112 |
| 46 |  Chile Chile |
108 |
| 47 |  Türkiye Türkiye |
105 |
| 48 |  Mexico Mexico |
86 |
| 49 |  Sao Tome and Principe Sao Tome and Principe |
64 |
| 50 |  Trinidad and Tobago Trinidad and Tobago |
59 |
| 51 |  Andorra Andorra |
59 |
| 52 |  Ukraine Ukraine |
56 |
| 53 |  Brazil Brazil |
53 |
| 54 |  Iran Iran |
50 |
| 55 |  Mongolia Mongolia |
47 |
| 56 |  Panama Panama |
47 |
| 57 |  United Arab Emirates United Arab Emirates |
44 |
| 58 |  Zambia Zambia |
42 |
| 59 |  Saudi Arabia Saudi Arabia |
40 |
| 60 |  Bahrain Bahrain |
37 |
| 61 |  Thailand Thailand |
34 |
| 62 |  Uruguay Uruguay |
33 |
| 63 |  Argentina Argentina |
29 |
| 64 |  Costa Rica Costa Rica |
28 |
| 65 |  Viet Nam Viet Nam |
23 |
| 66 |  Georgia Georgia |
23 |
| 67 |  Barbados Barbados |
22 |
| 68 |  Qatar Qatar |
18 |
| 69 |  Saint Vincent and the Grenadines Saint Vincent and the Grenadines |
18 |
| 70 |  Colombia Colombia |
17 |
| 71 |  Jamaica Jamaica |
16 |
| 72 |  India India |
16 |
| 73 |  Algeria Algeria |
15 |
| 74 |  Belarus Belarus |
15 |
| 75 |  El Salvador El Salvador |
14 |
| 76 |  Kazakhstan Kazakhstan |
14 |
| 77 |  Namibia Namibia |
14 |
| 78 |  Peru Peru |
13 |
| 79 |  Philippines Philippines |
13 |
| 80 |  Morocco Morocco |
13 |
| 81 |  Iraq Iraq |
11 |
| 82 |  Dominican Republic Dominican Republic |
10 |
| 83 |  Moldova Moldova |
10 |
| 84 |  Ghana Ghana |
10 |
| 85 |  Oman Oman |
8 |
| 86 |  Sri Lanka Sri Lanka |
5 |
| 87 |  Egypt Egypt |
5 |
| 88 |  Honduras Honduras |
4 |
| 89 |  Azerbaijan Azerbaijan |
4 |
| 90 |  Cuba Cuba |
4 |
| 91 |  Paraguay Paraguay |
4 |
| 92 |  Uzbekistan Uzbekistan |
3 |
| 93 |  Syria Syria |
3 |
| 94 |  Kyrgyzstan Kyrgyzstan |
3 |
| 95 |  Zimbabwe Zimbabwe |
2 |
| 96 |  Bosnia and Herzegovina Bosnia and Herzegovina |
2 |
| 97 |  Kuwait Kuwait |
2 |
| 98 |  Bangladesh Bangladesh |
1 |
| 99 |  Guatemala Guatemala |
1 |
| 100 |  Ecuador Ecuador |
1 |
| 101 |  Pakistan Pakistan |
1 |
| 102 |  Cyprus Cyprus |
1 |
| 103 |  Madagascar Madagascar |
1 |
| 104 |  Bhutan Bhutan |
1 |
| 105 |  Venezuela Venezuela |
1 |
| 106 |  Armenia Armenia |
1 |
| 107 |  Greece Greece |
0 |
| 108 |  Ethiopia Ethiopia |
0 |
| 109 |  Uganda Uganda |
0 |
| 110 |  Myanmar Myanmar |
0 |
Monaco and Luxembourg stand far above the rest, but their rankings are likely shaped by their role as legal hubs for intellectual property rather than where innovation physically takes place.
This pattern continues with Ireland and Switzerland, which also rank highly due to favorable tax and regulatory environments for holding patents.
Among major industrial economies, South Korea stands out with 2,536 patents per 100,000 people, outperforming Japan, the U.S., and China. Home to global tech giants like Samsung and LG, the country has built a strong ecosystem for innovation.
Across Europe, several smaller economies also rank highly. Nordic countries in particular combine modest populations with strong research and development investment, with Iceland reaching 2,418 patents per 100,000 people.
By contrast, the U.S. records 1,051 patents per 100,000 people, placing it behind much of Western Europe on this metric.
China’s reputation as the maker of cheap goods and toys has evolved significantly in recent years, and today it is known as a technology leader. The country leads in raw numbers with 5.6 million active patents but when adjusting for population, it sits behind 34 other countries at just 404 patents per 100,000 people.
Innovation Isn’t Always Registered Where It Is Made
Patent data often reflects where intellectual property is registered rather than where innovation actually occurs.
Multinational companies frequently shift patents across borders to benefit from tax advantages, royalty structures, or legal protections.
As a result, countries with favorable IP regimes can appear disproportionately strong in per-capita rankings, even if much of the underlying innovation originates elsewhere.
Learn More on the Voronoi App
To learn more about patents, check out this graphic which ranks the countries with the most AI patents.