 See more visuals like this on the Voronoi app.
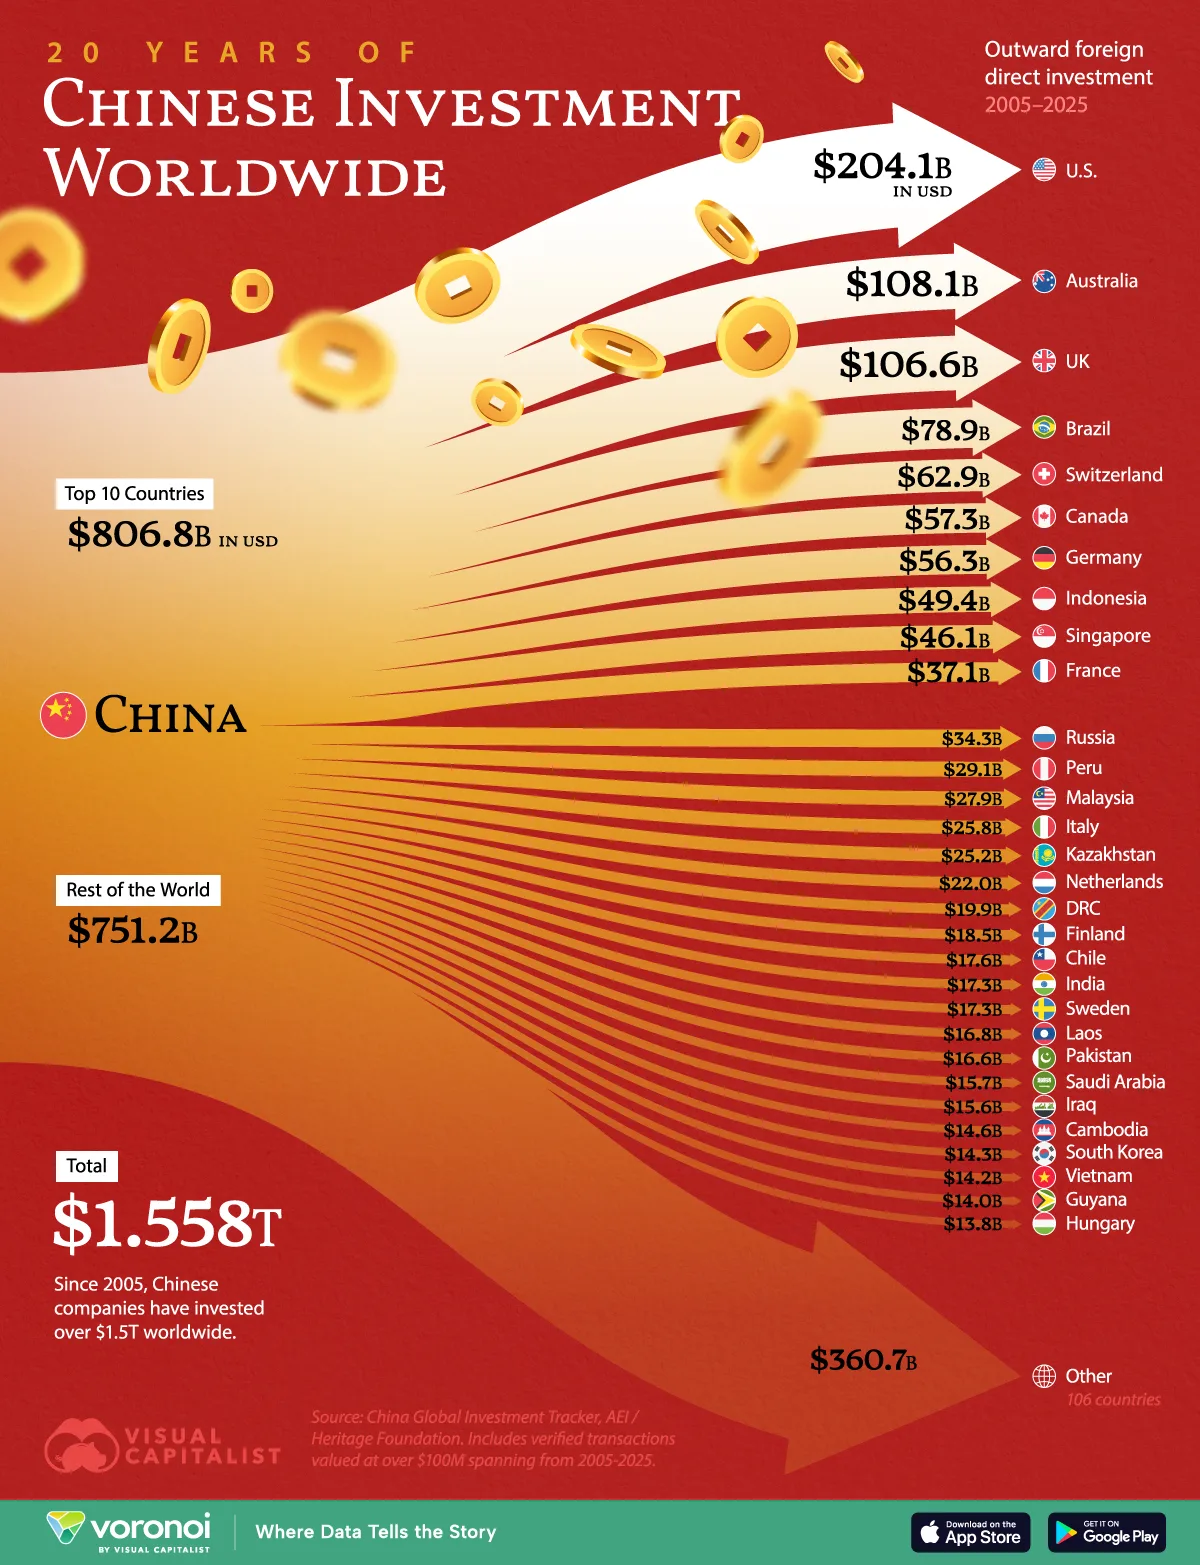
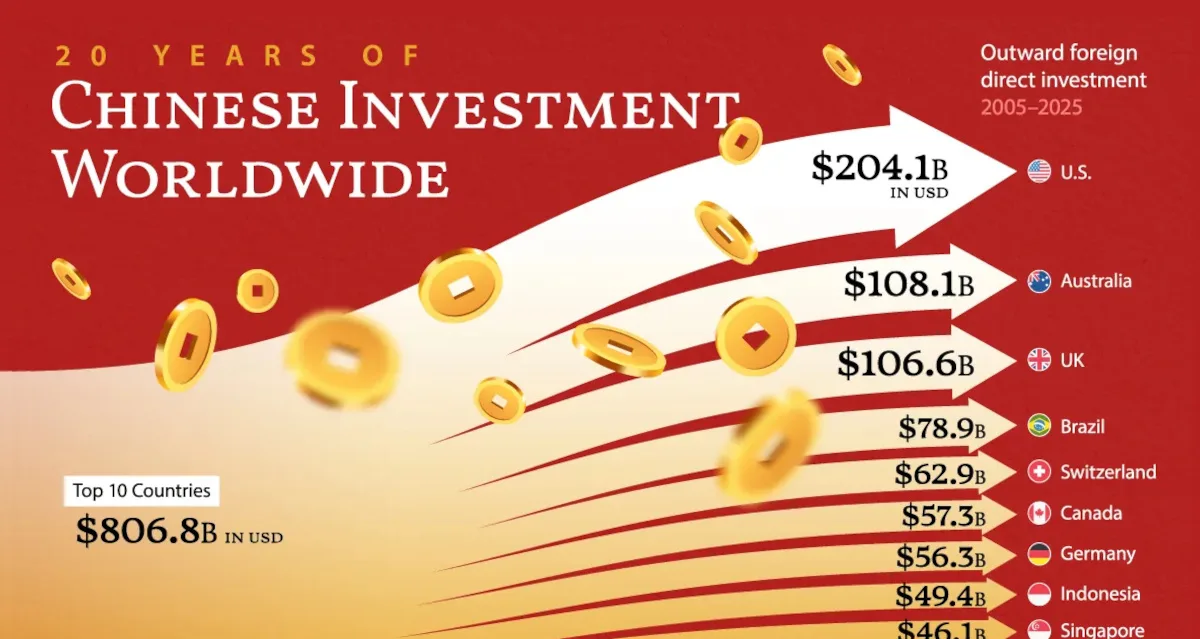
Where China Has Invested Most in the Last 20 Years
See visuals like this from many other data creators on our Voronoi app. Download it for free on iOS or Android and discover incredible data-driven charts from a variety of trusted sources.
Key Takeaways
- Between 2005 and 2025, Chinese companies invested over $1.5 trillion overseas.
- Over half of this amount went to just ten countries.
- The U.S. was the largest single investment destination, receiving over $204 billion in investments.
As China has grown to become the world’s second-largest economy, its role in global markets has also shifted. Whereas once China was primarily seen as a destination for international investment, in recent decades it has become an increasingly large investment source itself.
This graphic maps out China’s overseas investment since 2005, highlighting the distribution of Chinese foreign direct investment in different countries using data from the China Global Investment Tracker (CGIT) co-produced by the American Enterprise Institute and the Heritage Foundation.
Between 2005 and 2025, Chinese companies invested over $1.5 trillion abroad, with over half of this investment ($806.8 billion) heading to just 10 countries. Only transactions valued at $100 million or more were included.
The Reality of Sino-American Investment Ties
No country has received more Chinese investment since the country’s opening than the United States, into which $204.14 billion has been invested by Chinese companies between 2005 and 2025. The largest single reported investment in the U.S. was Shuanghui’s $7.1 billion acquisition of Smithfield Foods, the world’s largest pork producer, in 2013.
The data table below provides an overview of the dozens of Chinese investment destinations worldwide:
| Rank | Country | Chinese Investment in $B (2005-2025) |
|---|---|---|
| 1 |  United States United States |
204.14 |
| 2 |  Australia Australia |
108.12 |
| 3 |  United Kingdom United Kingdom |
106.58 |
| 4 |  Brazil Brazil |
78.88 |
| 5 |  Switzerland Switzerland |
62.87 |
| 6 |  Canada Canada |
57.28 |
| 7 |  Germany Germany |
56.34 |
| 8 |  Indonesia Indonesia |
49.37 |
| 9 |  Singapore Singapore |
46.11 |
| 10 |  France France |
37.07 |
| 11 |  Russia Russia |
34.25 |
| 12 |  Peru Peru |
29.10 |
| 13 |  Malaysia Malaysia |
27.93 |
| 14 |  Italy Italy |
25.75 |
| 15 |  Kazakhstan Kazakhstan |
25.22 |
| 16 |  Netherlands Netherlands |
21.95 |
| 17 |  Congo, Democratic Republic of the Congo, Democratic Republic of the |
19.93 |
| 18 |  Finland Finland |
18.48 |
| 19 |  Chile Chile |
17.55 |
| 20 |  India India |
17.28 |
| 21 |  Sweden Sweden |
17.25 |
| 22 |  Laos Laos |
16.82 |
| 23 |  Pakistan Pakistan |
16.56 |
| 24 |  Saudi Arabia Saudi Arabia |
15.70 |
| 25 |  Iraq Iraq |
15.56 |
| 26 |  Cambodia Cambodia |
14.59 |
| 27 |  Korea, South Korea, South |
14.31 |
| 28 |  Vietnam Vietnam |
14.21 |
| 29 |  Guyana Guyana |
14.04 |
| 30 |  Hungary Hungary |
13.80 |
| 31 |  Spain Spain |
13.54 |
| 32 |  Argentina Argentina |
13.21 |
| 33 |  Japan Japan |
12.78 |
| 34 |  Israel Israel |
12.73 |
| 35 |  Guinea Guinea |
12.11 |
| 36 |  Portugal Portugal |
11.80 |
| 37 |  Thailand Thailand |
11.73 |
| 38 |  South Africa South Africa |
11.73 |
| 39 |  Greece Greece |
9.66 |
| 40 |  Egypt Egypt |
8.75 |
| 41 |  Colombia Colombia |
8.35 |
| 42 |  Nigeria Nigeria |
8.28 |
| 43 |  United Arab Emirates United Arab Emirates |
8.16 |
| 44 |  Ireland Ireland |
8.12 |
| 45 |  Norway Norway |
7.97 |
| 46 |  Dominica Dominica |
7.96 |
| 47 |  Ecuador Ecuador |
7.96 |
| 48 |  Bangladesh Bangladesh |
7.74 |
| 49 |  Myanmar Myanmar |
7.09 |
| 50 |  Türkiye Türkiye |
6.83 |
| 51 |  Zambia Zambia |
6.78 |
| 52 |  Mexico Mexico |
6.50 |
| 53 |  Belgium Belgium |
5.83 |
| 54 |  Serbia Serbia |
5.76 |
| 55 |  Niger Niger |
5.57 |
| 56 |  Angola Angola |
5.50 |
| 57 |  Mozambique Mozambique |
4.92 |
| 58 |  Iran Iran |
4.72 |
| 59 |  Mongolia Mongolia |
4.66 |
| 60 |  Ghana Ghana |
4.65 |
| 61 |  Zimbabwe Zimbabwe |
4.59 |
| 62 |  Venezuela Venezuela |
4.57 |
| 63 |  Philippines Philippines |
4.38 |
| 64 |  Uzbekistan Uzbekistan |
4.38 |
| 65 |  Sri Lanka Sri Lanka |
4.30 |
| 66 |  Namibia Namibia |
4.21 |
| 67 |  Sierra Leone Sierra Leone |
3.85 |
| 68 |  Morocco Morocco |
3.82 |
| 69 |  New Zealand New Zealand |
3.80 |
| 70 |  Syria Syria |
3.76 |
| 71 |  Oman Oman |
3.73 |
| 72 |  Brunei Brunei |
3.59 |
| 73 |  Uganda Uganda |
3.32 |
| 74 |  Afghanistan Afghanistan |
3.07 |
| 75 |  Botswana Botswana |
2.85 |
| 76 |  Luxembourg Luxembourg |
2.79 |
| 77 |  Ethiopia Ethiopia |
2.77 |
| 78 |  Congo, Republic of the Congo, Republic of the |
2.61 |
| 79 |  Poland Poland |
2.61 |
| 80 |  Cameroon Cameroon |
2.58 |
| 81 |  Tanzania Tanzania |
2.58 |
| 82 |  Kenya Kenya |
2.32 |
| 83 |  Papua New Guinea Papua New Guinea |
2.30 |
| 84 |  Korea, North Korea, North |
2.00 |
| 85 |  Jordan Jordan |
1.96 |
| 86 |  Slovakia Slovakia |
1.86 |
| 87 |  Turkmenistan Turkmenistan |
1.79 |
| 88 |  Chad Chad |
1.63 |
| 89 |  Kyrgyzstan Kyrgyzstan |
1.62 |
| 90 |  Slovenia Slovenia |
1.39 |
| 91 |  Taiwan Taiwan |
1.22 |
| 92 |  Cyprus Cyprus |
1.20 |
| 93 |  Jamaica Jamaica |
1.17 |
| 94 |  Trinidad and Tobago Trinidad and Tobago |
1.17 |
| 95 |  Nepal Nepal |
1.12 |
| 96 |  Austria Austria |
1.11 |
| 97 |  Eritrea Eritrea |
1.07 |
| 98 |  Qatar Qatar |
1.05 |
| 99 |  Tajikistan Tajikistan |
1.00 |
| 100 |  Algeria Algeria |
0.96 |
| 101 |  Czechia Czechia |
0.86 |
| 102 |  Denmark Denmark |
0.84 |
| 103 |  Côte d’Ivoire Côte d’Ivoire |
0.79 |
| 104 |  Antigua and Barbuda Antigua and Barbuda |
0.74 |
| 105 |  Mauritius Mauritius |
0.74 |
| 106 |  Bosnia and Herzegovina Bosnia and Herzegovina |
0.73 |
| 107 |  Djibouti Djibouti |
0.70 |
| 108 |  Kuwait Kuwait |
0.65 |
| 109 |  Mali Mali |
0.60 |
| 110 |  Liberia Liberia |
0.52 |
| 111 |  Cuba Cuba |
0.50 |
| 112 |  Yemen Yemen |
0.47 |
| 113 |  Bulgaria Bulgaria |
0.44 |
| 114 |  Malta Malta |
0.44 |
| 115 |  Bolivia Bolivia |
0.40 |
| 116 |  Belarus Belarus |
0.40 |
| 117 |  Gabon Gabon |
0.40 |
| 118 |  Georgia Georgia |
0.37 |
| 119 |  Suriname Suriname |
0.36 |
| 120 |  Bahamas Bahamas |
0.35 |
| 121 |  Panama Panama |
0.31 |
| 122 |  Nicaragua Nicaragua |
0.30 |
| 123 |  Azerbaijan Azerbaijan |
0.27 |
| 124 |  Sao Tome and Principe Sao Tome and Principe |
0.27 |
| 125 |  Sudan Sudan |
0.26 |
| 126 |  Croatia Croatia |
0.22 |
| 127 |  Malawi Malawi |
0.20 |
| 128 |  Solomon Islands Solomon Islands |
0.20 |
| 129 |  Togo Togo |
0.19 |
| 130 |  Ukraine Ukraine |
0.18 |
| 131 |  Guinea-Bissau Guinea-Bissau |
0.17 |
| 132 |  Madagascar Madagascar |
0.15 |
| 133 |  Tunisia Tunisia |
0.13 |
| 134 |  Rwanda Rwanda |
0.12 |
| 135 |  Maldives Maldives |
0.11 |
| 136 |  Samoa Samoa |
0.11 |
| 137 |  Montenegro Montenegro |
0.10 |
| 138 |  Honduras Honduras |
0.00 |
Major foreign investments and acquisitions are subject to approval by the Committee on Foreign Investment in the United States (CFIUS), which in recent years has grown increasingly skeptical of Chinese investment as U.S.-China relations have worsened.
However, 2025 still saw over $3.79 billion in new investments, indicating that even growing bilateral competition does not mean full economic decoupling between the world’s two largest economies.
The Remainder of the Top 10
Following the U.S., a majority of the top 10 Chinese investment destinations since 2005 are large, developed Western economies like Australia ($108.1 billion), Switzerland ($62.9 billion), Canada ($57.3 billion), Germany ($56.3 billion), France ($37.1 billion), and the United Kingdom ($106.6 billion).
There are two major emerging-market exceptions to this, Brazil ($78.9 billion) and Indonesia ($49.4 billion), both of which are BRICS+ partners of China. Brazil was the top investment destination worldwide in 2025, receiving over $7.31 billion in capital from major Chinese firms such as State Grid and China Communications Construction.
Singapore, a city-state of just over 6 million people, has seen over $46 billion in investment since 2005, a figure roughly equivalent to that seen in Indonesia, the world’s fourth most-populous country, reflecting the value of a mature and diversified economy in attracting Chinese investment.
One notable exception from the top 10: India, the world’s fourth-largest economy and a BRICS+ giant, which received only $17.3 billion in Chinese investment over this period, a consequence perhaps of Sino-Indian diplomatic and economic tensions.
The Role of State-Owned Corporations
Unlike other major investor peers like Germany, Japan, or the U.S., China’s outward investment activity is dominated by state-owned enterprises in key sectors such as energy, infrastructure, and logistics.
For example, State Grid, a utility giant and the world’s third-largest company by overall revenue behind only Walmart and Amazon, has invested over $33 billion abroad since 2005, with particularly massive investments in Australia, Brazil, Chile, Italy, Russia, and the Philippines.
Other state-owned energy conglomerates such as China National Petroleum Corporation and China Three Gorges have also invested tens of billions of dollars overseas in recent decades, seeking both to secure resources for China’s growing demand while also addressing infrastructure gaps in emerging markets.
Learn More on the Voronoi App
If you enjoyed today’s post, check out Visualizing China’s $18.6 Trillion Economy on Voronoi.