Mapped: Where Young Adults Live With Their Parents Most
See visuals like this from many other data creators on our Voronoi app. Download it for free on iOS or Android and discover incredible data-driven charts from a variety of trusted sources.
Key Takeaways
- One in three U.S. adults (ages 18–34) now live with their parents.
- The share ranges from 44.1% in New Jersey to just 12.3% in North Dakota, revealing a wide geographic divide.
- High-cost coastal and Northeastern states dominate the top of the ranking.
For many young Americans, moving out is becoming harder to afford.
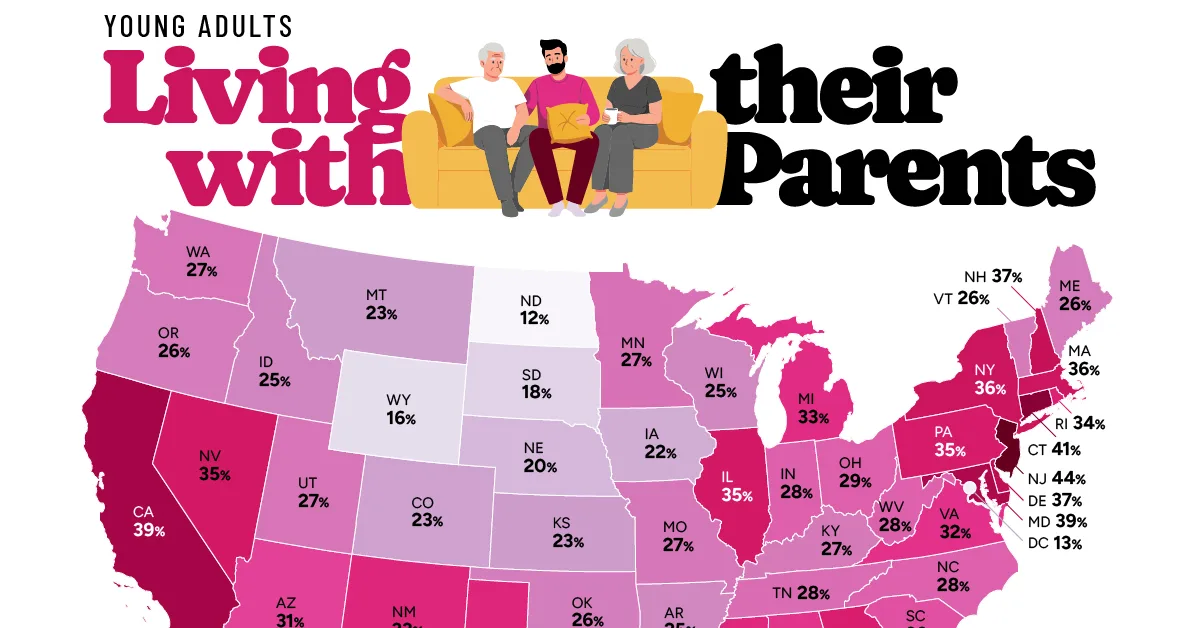
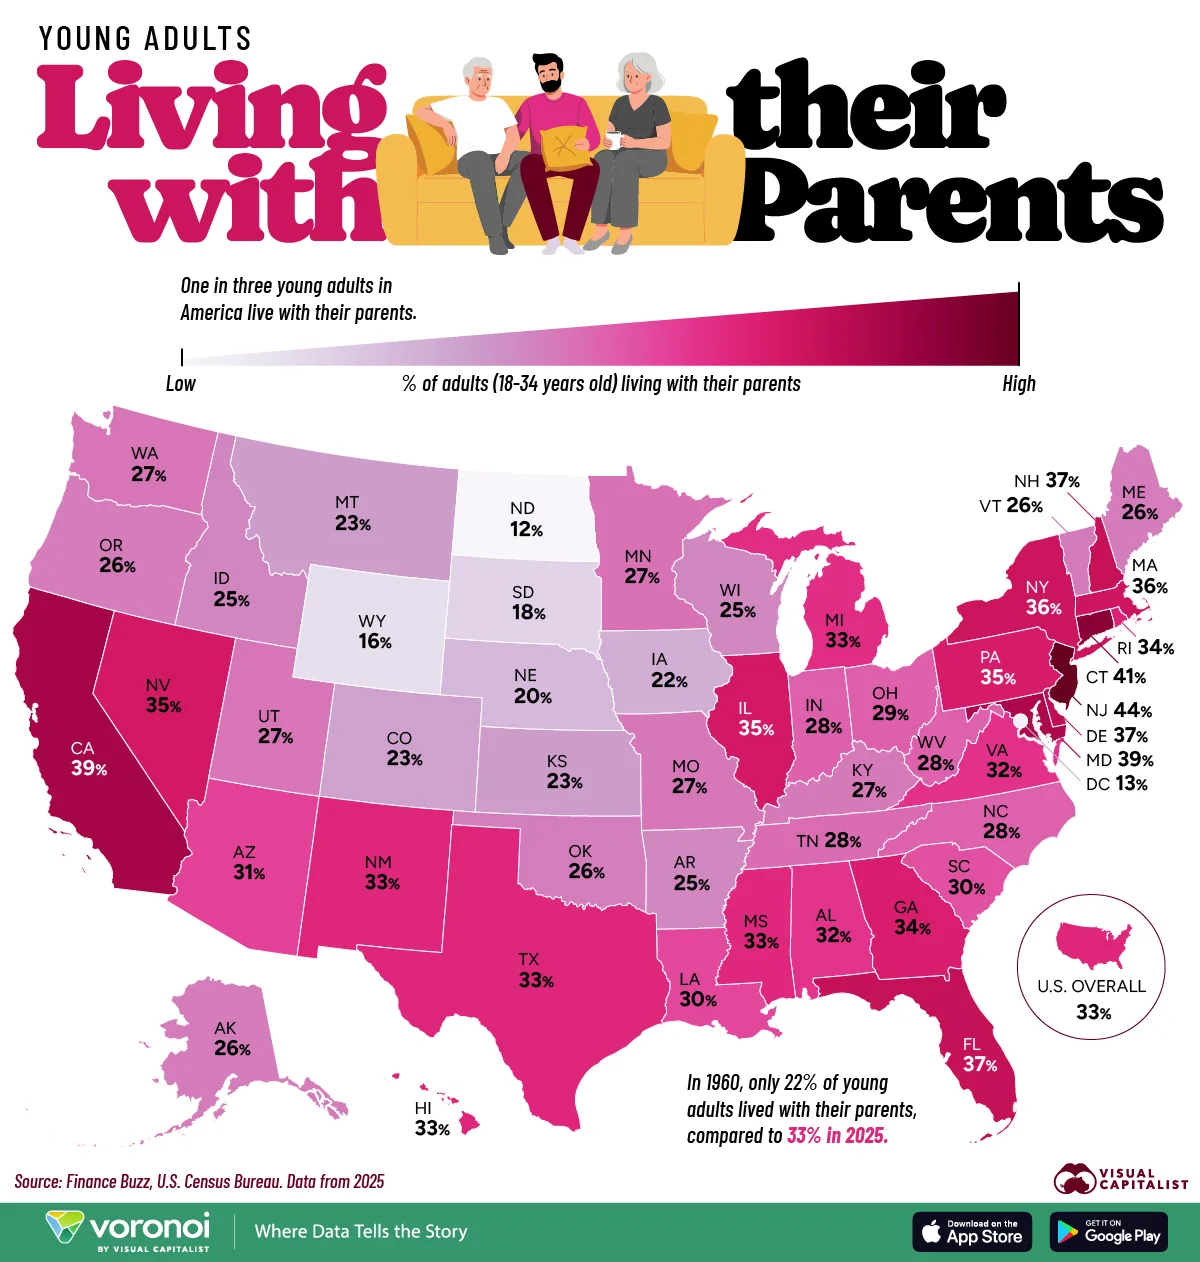
This map shows the share of 18–34-year-olds living with their parents in each U.S. state, using rounded 2025 U.S. Census Bureau data via FinanceBuzz.
Nationally, the figure now stands at 33%, meaning one in three young adults still live at home. That is slightly below the 2020 pandemic peak, but still far above historical norms and a sign of how sharply housing costs have reshaped the path to independence.
Ranked: States Where the Most Young Adults Live at Home
New Jersey leads the country by a wide margin, with 44.1% of young adults living with their parents, followed by Connecticut (41.3%). Several other high-cost states—including California and Maryland—also approach or exceed 38%.
The pattern is clear: states with higher housing costs and tighter supply consistently rank at the top. In these markets, renting or buying is significantly less attainable for young adults, increasing the likelihood of living at home.
The following data table reflects the percentage of young adults living with their parents in each U.S. state.
| Rank | State | Young adults living with parents (%) |
|---|---|---|
| 1 | New Jersey | 44.1% |
| 2 | Connecticut | 41.3% |
| 3 | California | 39.1% |
| 4 | Maryland | 38.5% |
| 5 | Delaware | 37.0% |
| 6 | Florida | 36.6% |
| 7 | New Hampshire | 36.5% |
| 8 | New York | 35.9% |
| 9 | Massachusetts | 35.7% |
| 10 | Illinois | 35.1% |
| 10 | Nevada | 35.1% |
| 12 | Pennsylvania | 34.7% |
| 13 | Georgia | 34.4% |
| 14 | Rhode Island | 33.8% |
| 15 | Hawaii | 33.3% |
| 16 | New Mexico | 33.2% |
| 16 | Texas | 33.2% |
| 18 | Mississippi | 33.0% |
| 19 | Michigan | 32.5% |
| 20 | Virginia | 32.0% |
| 21 | Alabama | 31.8% |
| 22 | Arizona | 30.7% |
| 23 | Louisiana | 30.2% |
| 24 | South Carolina | 29.6% |
| 25 | Ohio | 28.5% |
| 26 | Indiana | 28.4% |
| 27 | North Carolina | 28.3% |
| 27 | West Virginia | 28.3% |
| 29 | Tennessee | 27.5% |
| 30 | Minnesota | 27.1% |
| 31 | Utah | 26.8% |
| 31 | Washington | 26.8% |
| 33 | Missouri | 26.6% |
| 34 | Kentucky | 26.5% |
| 35 | Vermont | 26.4% |
| 36 | Alaska | 26.2% |
| 36 | Maine | 26.2% |
| 36 | Oregon | 26.2% |
| 39 | Oklahoma | 26.1% |
| 40 | Idaho | 25.4% |
| 41 | Arkansas | 25.3% |
| 41 | Wisconsin | 25.3% |
| 41 | Kansas | 23.3% |
| 41 | Montana | 23.3% |
| 45 | Colorado | 22.8% |
| 46 | Iowa | 21.6% |
| 47 | Nebraska | 20.4% |
| 48 | South Dakota | 17.7% |
| 49 | Wyoming | 16.2% |
| 50 | District of Columbia | 13.3% |
| 51 | North Dakota | 12.3% |
| — |  U.S. Average U.S. Average |
33.0% |
This geographic divide mirrors housing costs: high-cost Northeastern and coastal states consistently rank at the top, while more affordable states fall to the bottom.
The States With the Most Independent Young Adults
At the other end of the spectrum, lower-cost states show dramatically lower rates of co-residence. In North Dakota (12.3%), the share is nearly one-quarter of New Jersey’s, highlighting how affordability shapes independence.
Washington, D.C. stands out as an outlier, with just 13.3% of young adults living with their parents. This likely reflects the influx of young professionals who relocate to work in the capital.
By and large, however, the states with the lowest rates of “full nesters” are more affordable states like South Dakota (18%) and Nebraska (20%).
Nationwide Shifts: A Timeline Since 1960
Young adults may stay with their parents while studying, which would help to explain higher rates in leading educational centers like California or Maryland (both 39%). However, the increase seen at the national level in recent decades reflects a changing economic reality for young adults.
In 1960, less than a quarter of young adults lived with their parents. This rate increased to 30% by 2010, following the outbreak of the 2008 financial crisis, and peaked at over a third in 2020 during the COVID-19 pandemic.
Even after the pandemic, rates remain historically elevated—suggesting this is no longer a temporary shift, but a structural one. Rising housing costs continue to delay independence, and the data shows young men are more likely than young women to live with their parents.
Learn More on the Voronoi App 
If you enjoyed today’s post, check out U.S. Wages Haven’t Kept Up With Inflation on Voronoi, the new app from Visual Capitalist.