Mapped: Where Americans 65+ Are Still Working
See visuals like this from many other data creators on our Voronoi app. Download it for free on iOS or Android and discover incredible data-driven charts from a variety of trusted sources.
Key Takeaways
- Nearly 1 in 4 Americans over 65 is still working, often part-time
- Vermont and New Hampshire (28.6%) have the highest share of senior workers
- West Virginia (16.7%) has the lowest participation among retirement-age Americans
For a growing share of Americans, retirement no longer starts at 65.
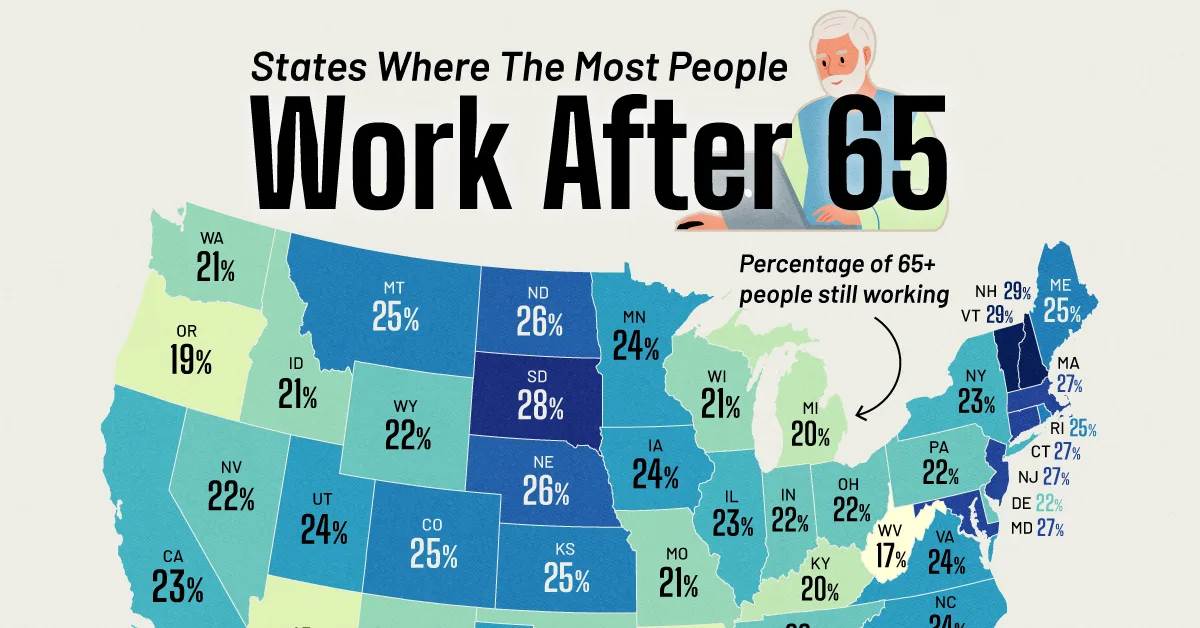
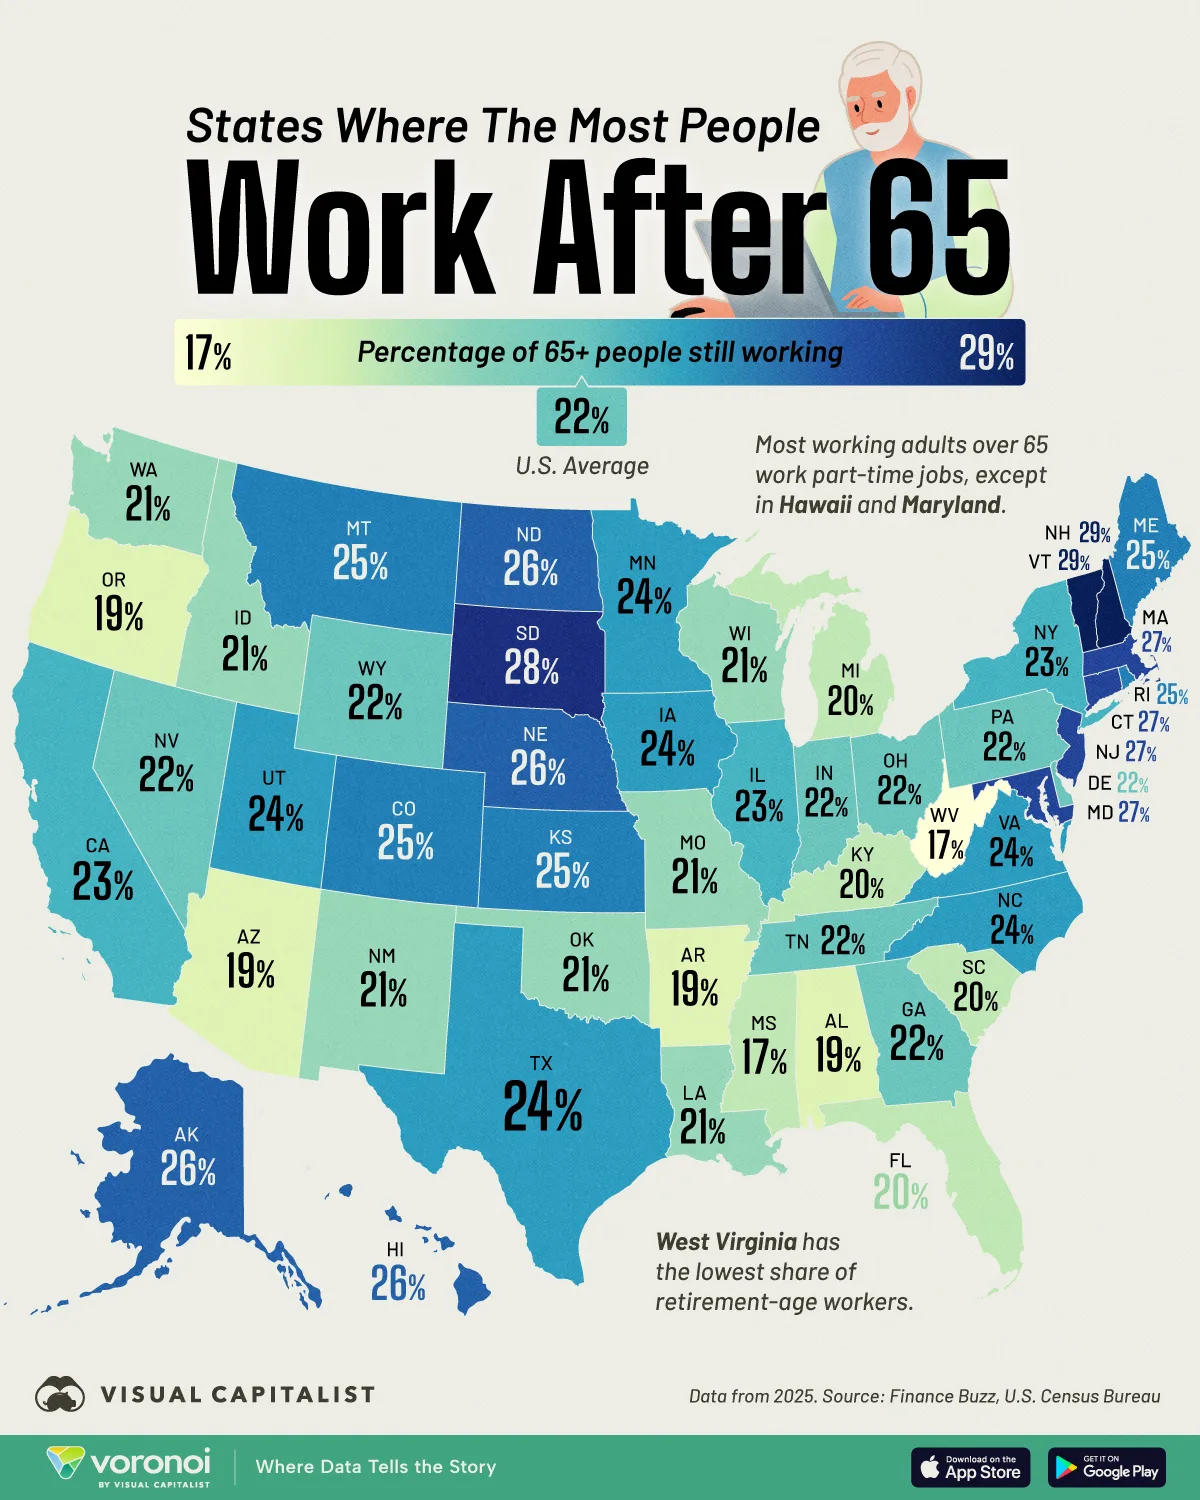
This map shows where people aged 65 and older are still working across U.S. states, based on 2024 data from the U.S. Census Bureau via FinanceBuzz.
About 22% of Americans 65+ remain in the workforce, but the share climbs to nearly one-third in some states. The gap highlights how cost of living, job availability, and shifting retirement systems are reshaping when—and whether—Americans stop working.
The Workforces With The Most Seniors
The New England states of Vermont and New Hampshire (both 28.6%) lead the country in the number of seniors still working, followed by South Dakota at 27.6%.
This data table highlights the percentage of retirement-age people still in the workforce per state.
| State | People Over 65 Still Working (%) |
|---|---|
| New Hampshire | 28.6% |
| Vermont | 28.6% |
| South Dakota | 27.6% |
| Massachusetts | 27.2% |
| Maryland | 26.8% |
| New Jersey | 26.8% |
| Connecticut | 26.5% |
| Nebraska | 26.1% |
| North Dakota | 25.7% |
| Hawaii | 25.6% |
| Alaska | 25.5% |
| Maine | 24.8% |
| Montana | 24.6% |
| Colorado | 24.5% |
| Kansas | 24.5% |
| Rhode Island | 24.5% |
| North Carolina | 24.0% |
| Virginia | 24.0% |
| Texas | 23.8% |
| Iowa | 23.7% |
| Minnesota | 23.5% |
| Utah | 23.5% |
| New York | 23.0% |
| Illinois | 22.8% |
| California | 22.7% |
| Indiana | 22.2% |
| Wyoming | 22.2% |
| Pennsylvania | 22.0% |
| Tennessee | 21.8% |
| Georgia | 21.7% |
| Delaware | 21.5% |
| Nevada | 21.5% |
| Ohio | 21.5% |
| Missouri | 21.4% |
| Wisconsin | 21.4% |
| Louisiana | 21.1% |
| Oklahoma | 21.1% |
| Washington | 20.9% |
| Idaho | 20.5% |
| New Mexico | 20.5% |
| Florida | 20.1% |
| Michigan | 20.1% |
| Kentucky | 19.9% |
| South Carolina | 19.9% |
| Mississippi | 19.6% |
| Alabama | 19.2% |
| Arizona | 19.2% |
| Oregon | 19.1% |
| Arkansas | 18.9% |
| West Virginia | 16.7% |
 U.S. Average U.S. Average |
22.4% |
A clear regional pattern emerges: Northeastern states dominate the top ranks, with many posting rates above 26%. Higher living costs and longer life expectancy likely contribute to more Americans 65+ staying in the workforce.
Most people are not working full-time, however. In fact, among its retirement-age workers, Vermont has the highest concentration of part-time employees nationwide, reflecting in part the social role work plays in many older Americans’ lives.
The Two Full-Time States
On the flip side, there’s Maryland, which has the highest share of full-time retirement-age workers in the country.
Maryland and Hawaii are actually the only two states in which a majority of working people aged 65 and up are employed full-time. Full-time work is generally essential for seniors who cannot rely on other retirement sources of income, such as Social Security, or who obtain needed benefits through their job.
The decline of traditional pensions is a key driver behind this shift. With retirement savings increasingly tied to 401(k) plans and market performance, many Americans are working longer to maintain financial security.
West Virginia and the Truly Retired
Among the 50 states in the country, West Virginia (16.7%) has the lowest share of retirement-age workers. It’s followed by Alabama, Arizona, Arkansas, and Oregon, all of which sit around 19%.
In lower-ranking states like West Virginia and Arkansas, fewer Americans 65+ remain in the workforce—likely reflecting a mix of fewer job opportunities and lower living costs. In these areas, retirement may still be more attainable than continuing to work.
They may also have differing lifestyle preferences, electing to devote more time to family commitments than to the structure or social component of a job or so-called “side hustle.”
Learn More on the Voronoi App 
If you enjoyed today’s post, check out Mapping Unemployment Claims per 100,000 Workers on Voronoi, the new app from Visual Capitalist.