Ranked: The Most Productive Countries in the World
See visuals like this from many other data creators on our Voronoi app. Download it for free on iOS or Android and discover incredible data-driven charts from a variety of trusted sources.
Key Takeaways
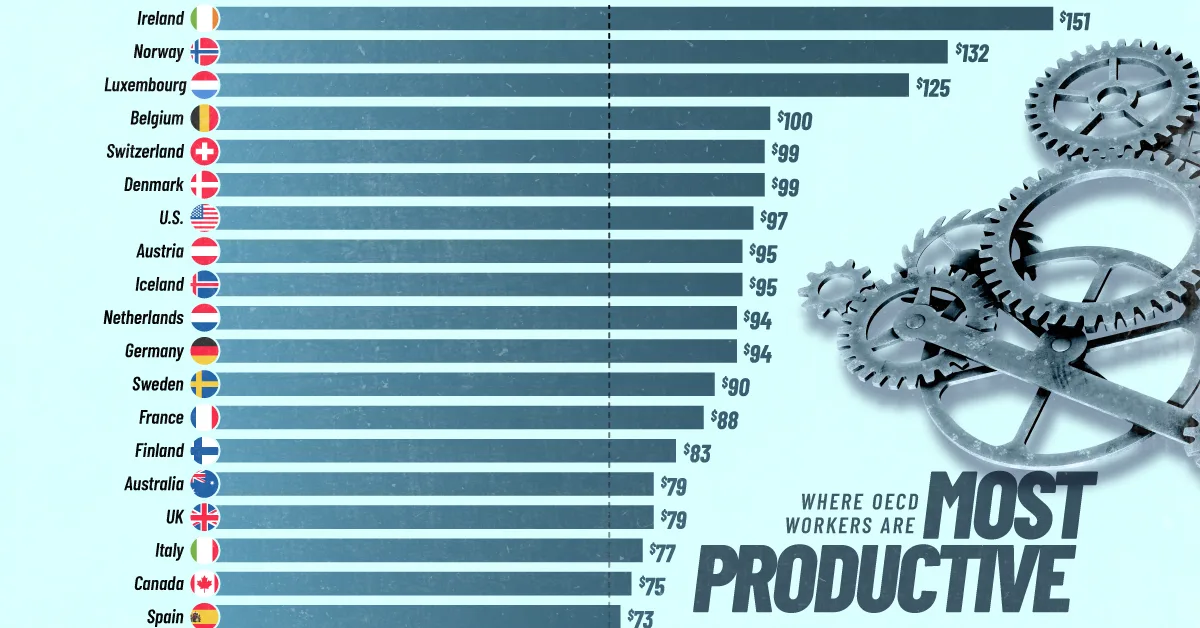
- Ireland ranks #1 in GDP per hour at $151, far ahead of its peers—but the figure is heavily influenced by multinational corporations.
- European economies dominate the top of the ranking, with Norway and Luxembourg also exceeding $120 per hour.
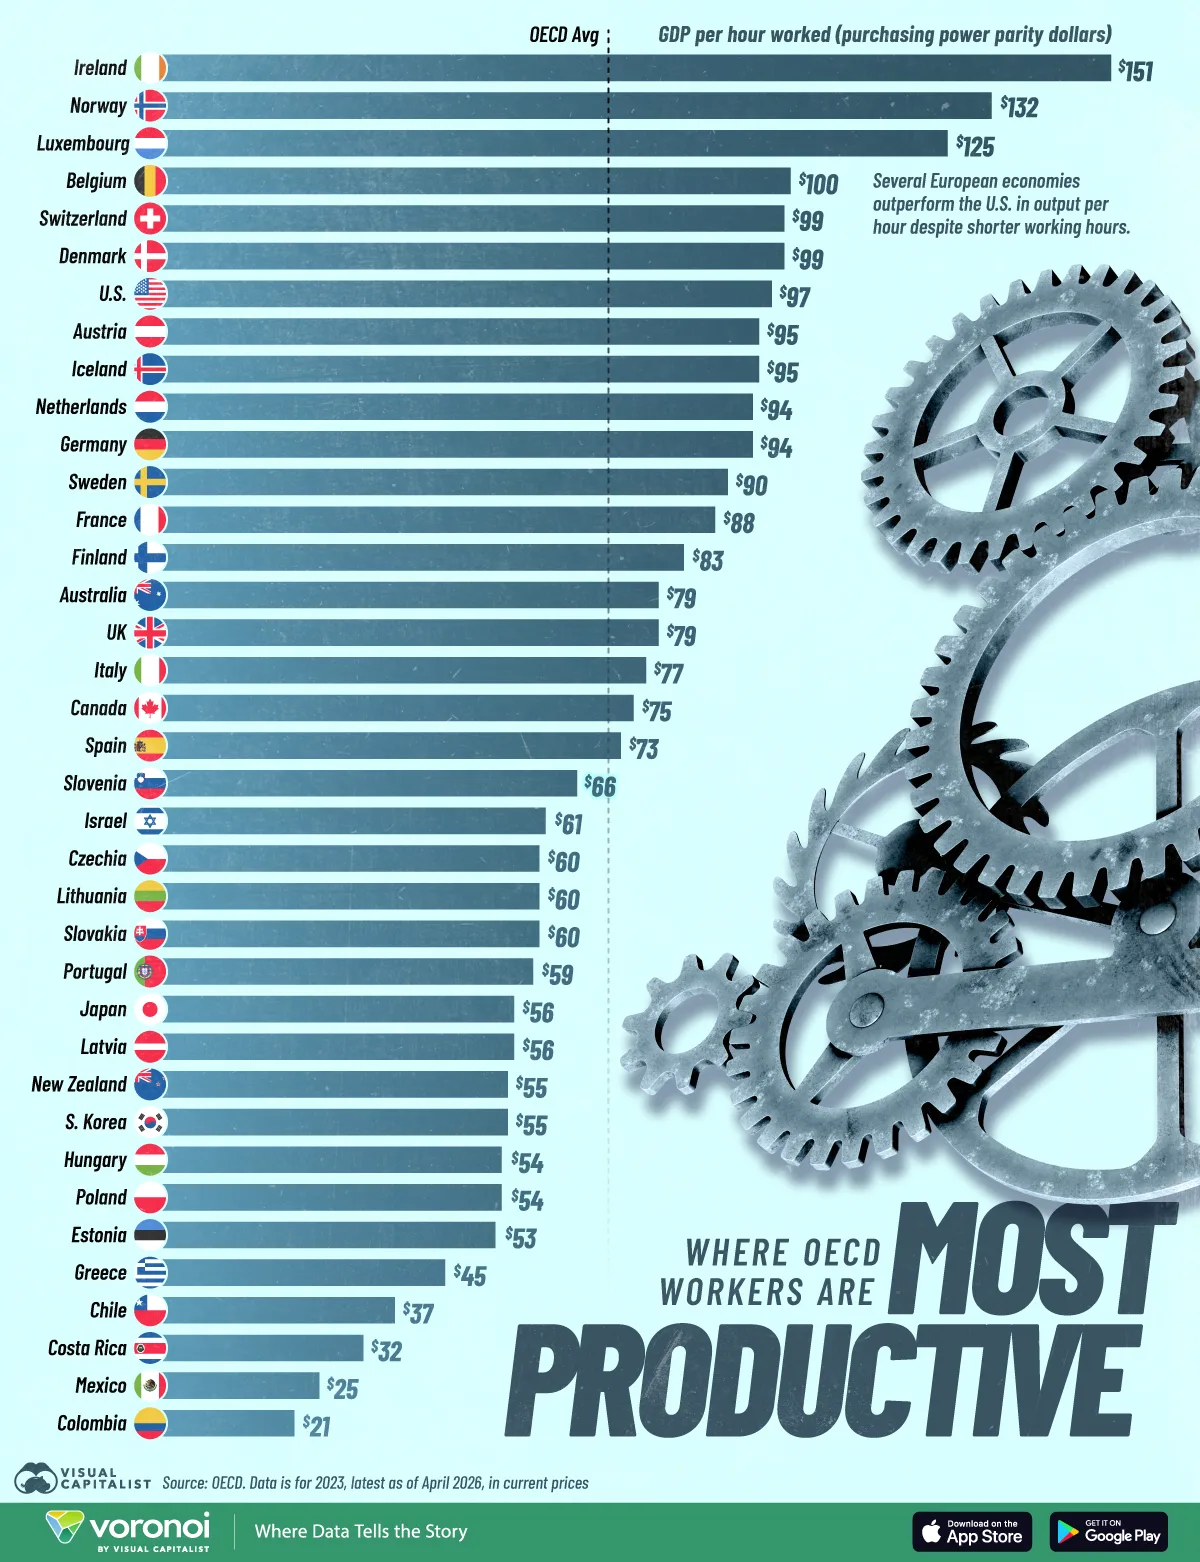
- The U.S. generates $97 per hour—above average, but behind many smaller, high-income economies.
Not all hours worked generate the same economic value.
This chart ranks OECD countries by GDP per hour worked, a common measure of productivity. The gap at the top is striking: Ireland produces over 50% more per hour than most advanced economies.
However, these figures come with an important caveat. In countries like Ireland and Luxembourg, productivity is significantly boosted by multinational firms shifting profits, which can inflate GDP relative to actual domestic output.
Using data from the OECD, this visualization highlights where workers appear most productive—and what drives those differences.
GDP per Hour Worked by Country
With output per hour at $151 in purchasing power parity-adjusted dollars, Ireland stands well above its peers.
This table shows GDP per hour worked by country in 2023, in PPP-adjusted dollars, which account for differences in cost of living:
| Country | GDP Per Hour Worked Purchasing Power Parity Dollars |
|---|---|
 Ireland Ireland |
$151 |
 Norway Norway |
$132 |
 Luxembourg Luxembourg |
$125 |
 Belgium Belgium |
$100 |
 Switzerland Switzerland |
$99 |
 Denmark Denmark |
$99 |
 United States United States |
$97 |
 Austria Austria |
$95 |
 Iceland Iceland |
$95 |
 Netherlands Netherlands |
$94 |
 Germany Germany |
$94 |
 Sweden Sweden |
$90 |
 France France |
$88 |
 Finland Finland |
$83 |
 Australia Australia |
$79 |
 United Kingdom United Kingdom |
$79 |
 Italy Italy |
$77 |
 Canada Canada |
$75 |
 Spain Spain |
$73 |
 Slovenia Slovenia |
$66 |
 Israel Israel |
$61 |
 Czechia Czechia |
$60 |
 Lithuania Lithuania |
$60 |
 Slovak Republic Slovak Republic |
$60 |
 Portugal Portugal |
$59 |
 Japan Japan |
$56 |
 Latvia Latvia |
$56 |
 New Zealand New Zealand |
$55 |
 Korea Korea |
$55 |
 Hungary Hungary |
$54 |
 Poland Poland |
$54 |
 Estonia Estonia |
$53 |
 Greece Greece |
$45 |
 Chile Chile |
$37 |
 Costa Rica Costa Rica |
$32 |
 Mexico Mexico |
$25 |
 Colombia Colombia |
$21 |
 OECD Average OECD Average |
$71 |
Ireland’s productivity is heavily influenced by the presence of multinational corporations, particularly in tech and pharmaceuticals. For perspective, Ireland’s productivity drops by 31% to $115 when using gross national income (GNI) as an alternative measure.
Norway ($132) and Luxembourg ($125) also benefit from distinct structural advantages. Norway is supported by its energy sector, while Luxembourg’s finance industry significantly boosts its output. Similarly, Luxembourg’s productivity drops by 54% when measured using GNI.
Countries with a higher concentration of capital-intensive or knowledge-based industries, such as technology, finance, and pharmaceuticals, tend to generate more value per hour.
Meanwhile, economies with larger shares of agriculture, tourism, or lower-value services typically report lower productivity levels.
This helps explain why countries like the U.S. ($97) and Germany ($88) rank above the OECD average of $71, given their strong industrial and innovation-driven sectors, while others fall further down the list.
Learn More on the Voronoi App 
To learn more about this topic, check out this graphic on the world’s 50 largest economies by GDP in 2026.