Mapped: The Happiest States in America
See visuals like this from many other data creators on our Voronoi app. Download it for free on iOS or Android and discover incredible data-driven charts from a variety of trusted sources.
Key Takeaways
- Hawaii ranks as the happiest U.S. state, with Maryland, Nebraska, and New Jersey close behind.
- West Virginia places last, with a gap of over 30 points between the top and bottom states.
- Northeastern states dominate the top 10, while Southern states make up most of the bottom tier.
Your state might play a bigger role in your happiness than you think.
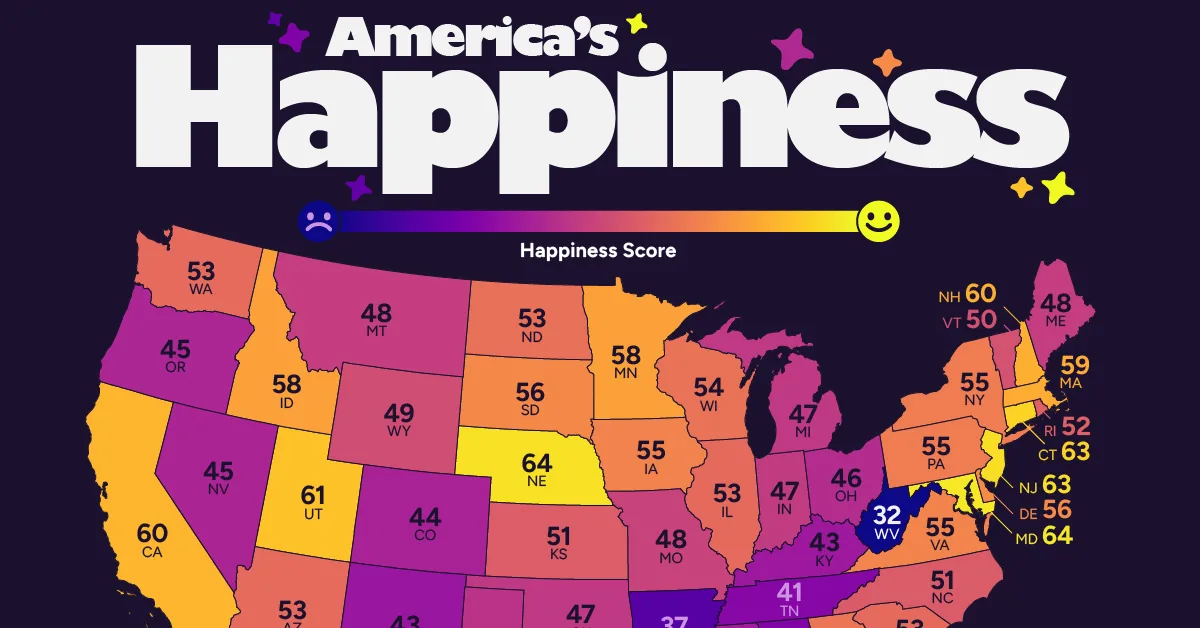
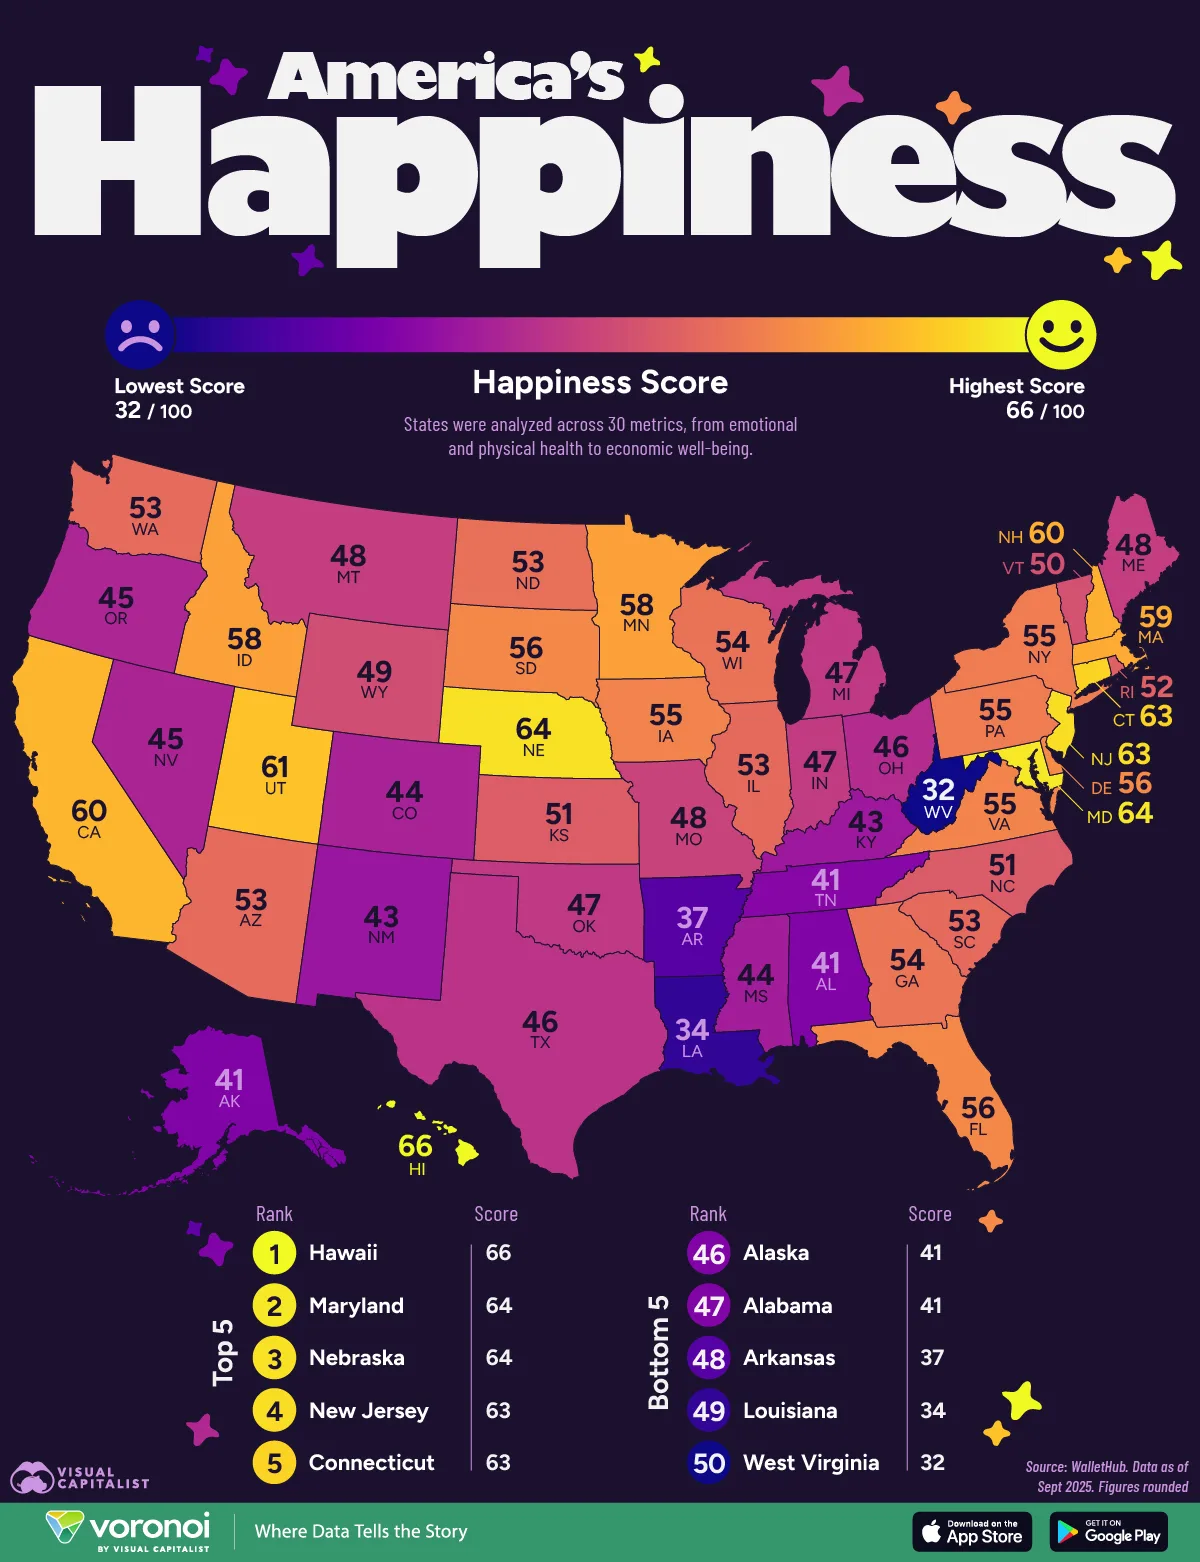
This map ranks all 50 states using a composite “happiness score,” revealing a wide gap between top-performing states like Hawaii and lower-ranked ones like West Virginia. The difference between first and last place exceeds 30 points, highlighting stark disparities in well-being across the country.
The data comes from WalletHub, which evaluated states across 30 metrics tied to emotional and physical health, income growth, work conditions, and community factors.
Why Hawaii and the Northeast Dominate the Rankings
Hawaii’s top ranking reflects strong performance across emotional well-being and community-related metrics.
The Northeast stands out as a clear hotspot for happiness, with multiple states clustering near the top of the rankings. In contrast, much of the South appears near the bottom, reinforcing a clear regional divide in overall well-being.
The data table below shows the happiness score and ranking of all 50 U.S. states:
| Rank | State | Happiness Score |
|---|---|---|
| 1 | Hawaii | 65.5 |
| 2 | Maryland | 64.1 |
| 3 | Nebraska | 63.6 |
| 4 | New Jersey | 63.4 |
| 5 | Connecticut | 62.5 |
| 6 | Utah | 61.1 |
| 7 | California | 60.1 |
| 8 | New Hampshire | 59.6 |
| 9 | Massachusetts | 59.2 |
| 10 | Idaho | 58.3 |
| 11 | Minnesota | 58.2 |
| 12 | Delaware | 56.1 |
| 13 | South Dakota | 55.9 |
| 14 | Florida | 55.9 |
| 15 | Virginia | 55.5 |
| 16 | New York | 55.4 |
| 17 | Iowa | 55.4 |
| 18 | Pennsylvania | 54.7 |
| 19 | Georgia | 53.9 |
| 20 | Wisconsin | 53.6 |
| 21 | North Dakota | 53.4 |
| 22 | Illinois | 53.4 |
| 23 | Arizona | 52.9 |
| 24 | Washington | 52.9 |
| 25 | South Carolina | 52.8 |
| 26 | Rhode Island | 51.7 |
| 27 | Kansas | 51.3 |
| 28 | North Carolina | 51.0 |
| 29 | Vermont | 49.9 |
| 30 | Wyoming | 49.5 |
| 31 | Missouri | 48.3 |
| 32 | Montana | 47.8 |
| 33 | Maine | 47.6 |
| 34 | Indiana | 47.4 |
| 35 | Michigan | 47.1 |
| 36 | Oklahoma | 47.1 |
| 37 | Texas | 46.4 |
| 38 | Ohio | 45.7 |
| 39 | Oregon | 44.9 |
| 40 | Nevada | 44.8 |
| 41 | Colorado | 44.5 |
| 42 | Mississippi | 43.9 |
| 43 | Kentucky | 43.3 |
| 44 | New Mexico | 43.1 |
| 45 | Tennessee | 41.2 |
| 46 | Alaska | 40.7 |
| 47 | Alabama | 40.7 |
| 48 | Arkansas | 37.0 |
| 49 | Louisiana | 34.3 |
| 50 | West Virginia | 32.0 |
| — |  Average Average |
51.2 |
One surprise in the rankings is Nebraska, which places third overall ahead of larger and wealthier states. Its strong performance reflects consistent results across multiple categories rather than dominance in any single metric.
Meanwhile, among the four most populous states, results vary widely, highlighting how size alone does not determine quality of life. California ranks 7th overall, while Texas falls to 37th, creating one of the largest gaps among peer states in the ranking.
Southern States Have the Lowest Happiness
The lowest-ranked states cluster heavily in the South, with West Virginia, Louisiana, and Arkansas all scoring well below the national average. These states tend to rank poorly in both health outcomes and work environment metrics, two of the most heavily weighted components in the index.
West Virginia’s last-place finish is driven by bottom rankings in both emotional and physical well-being and work environment. Louisiana also ranks 49th in those two categories, though a mid-pack community and environment result keeps it narrowly ahead of West Virginia overall.
How WalletHub Built the Happiness Ranking
WalletHub says the study draws on 30 indicators, ranging from depression rates and the share of adults feeling productive to income growth and unemployment. According to the source methodology, the underlying data used to build the ranking was collected as of June 23, 2025, from a mix of federal agencies, Gallup, TransUnion, Sharecare, AmeriCorps, and other organizations.
Rather than capturing momentary mood, the ranking reflects broader living conditions. By combining health, economic, and community indicators, it offers a more comprehensive view of what drives happiness across states.
Learn More on the Voronoi App 
If you enjoyed today’s post, check out this map of the world’s happiest countries on Voronoi.