 See more visualizations like this on the Voronoi app.
Where Populations Are Booming and Shrinking by 2050
See visuals like this from many other data creators on our Voronoi app. Download it for free on iOS or Android and discover incredible data-driven charts from a variety of trusted sources.
Key Takeaways
- Sub-Saharan Africa is set to drive the majority of global population growth through 2050.
- Several major economies—including China, Japan, and much of Europe—are projected to shrink.
- The Democratic Republic of Congo could nearly double its population, the fastest growth globally.
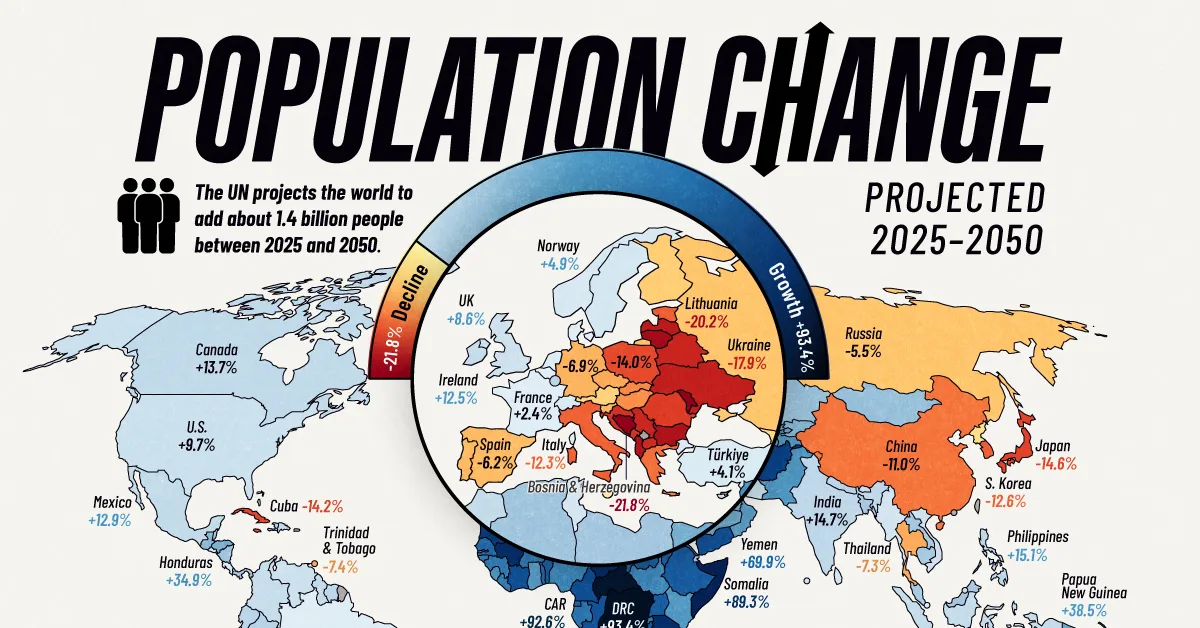
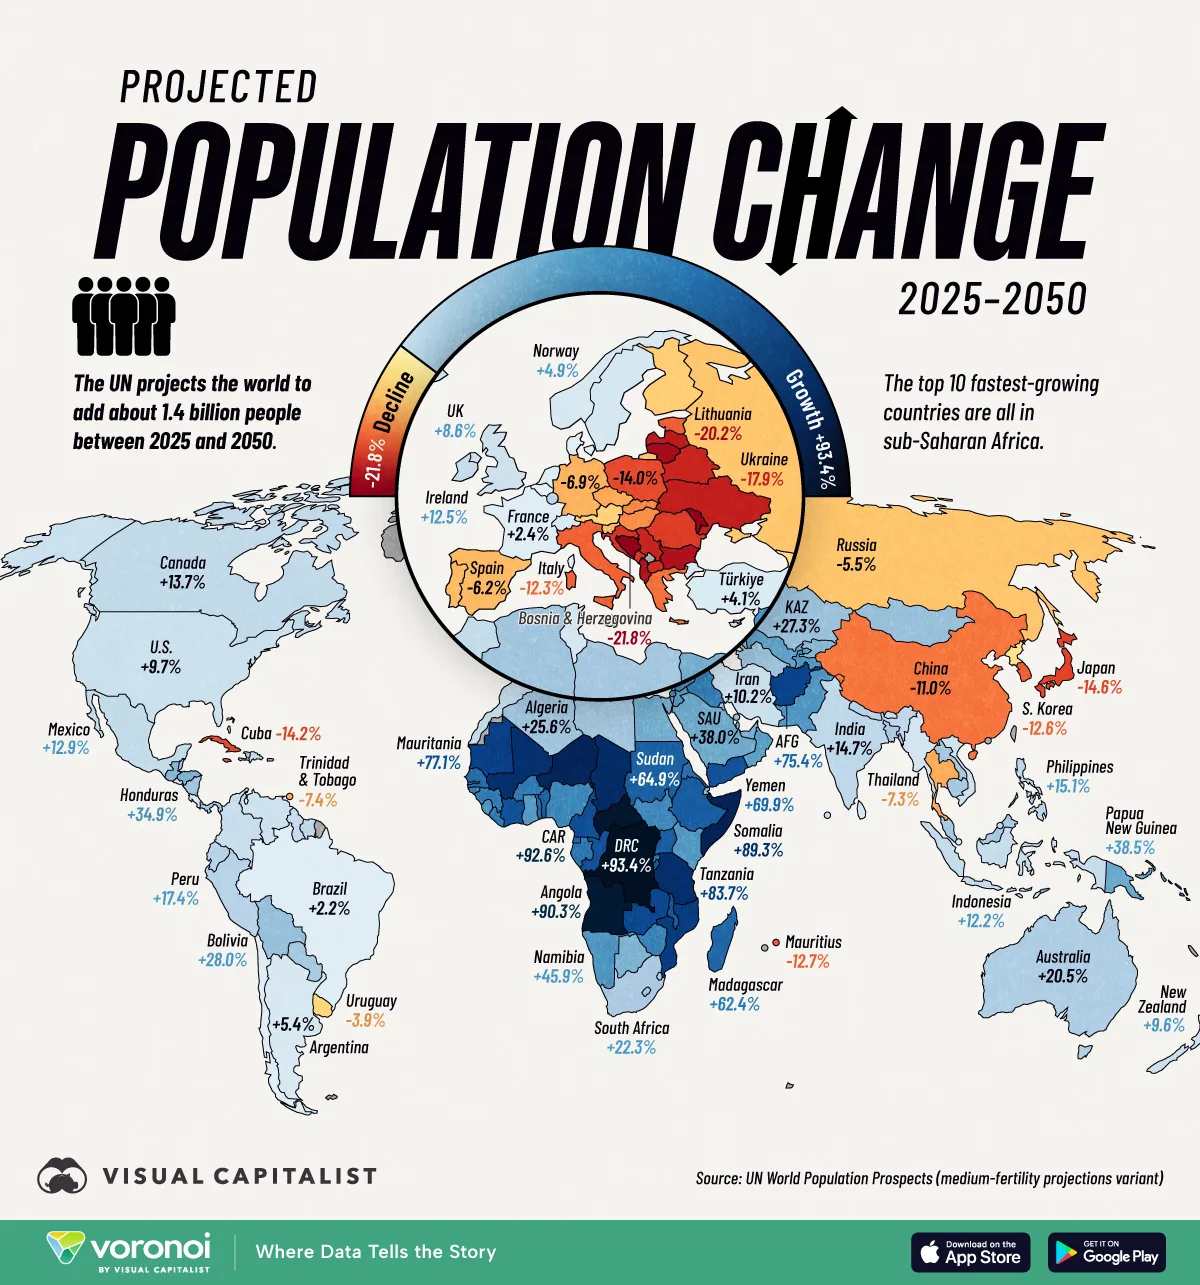
The world’s population is projected to grow by 1.4 billion people by 2050—but that growth is becoming increasingly concentrated in a handful of regions.
Using data from the United Nations’ World Population Prospects 2024, this map shows where populations are rising fastest—and where they are entering long-term decline. The contrast is stark: parts of sub-Saharan Africa are set to nearly double in size, while several of the world’s largest economies are projected to shrink significantly.
These shifts will reshape labor markets, economic growth, and global influence over the coming decades.
The Fastest-Growing Countries in the World
The most dramatic population increases are concentrated in sub-Saharan Africa, where several countries are on track to nearly double in size by 2050.
The Democratic Republic of Congo leads globally, with its population projected to surge by over 100 million people (+93%). Close behind are countries like Niger, Angola, and Somalia.
The table below shows population forecasts across 195 countries worldwide:
| Rank | Country | Population 2025 (M) | Population 2050 (M) | Change 2020- 2025 |
% Change 2020- 2025 |
|---|---|---|---|---|---|
| 1 |  DR Congo DR Congo |
112.8 | 218.2 | +105.4M | 93.4% |
| 2 |  Central African Republic Central African Republic |
5.5 | 10.6 | +5.1M | 92.6% |
| 3 |  Angola Angola |
39 | 74.3 | +35.3M | 90.3% |
| 4 |  Somalia Somalia |
19.7 | 37.2 | +17.6M | 89.3% |
| 5 |  Niger Niger |
27.9 | 52.5 | +24.6M | 88.1% |
| 6 |  Chad Chad |
21 | 38.9 | +17.9M | 85.0% |
| 7 |  Tanzania Tanzania |
70.5 | 129.6 | +59.1M | 83.7% |
| 8 |  Mali Mali |
25.2 | 46.2 | +21.0M | 83.2% |
| 9 |  Mozambique Mozambique |
35.6 | 63.5 | +27.9M | 78.3% |
| 10 |  Mauritania Mauritania |
5.3 | 9.4 | +4.1M | 77.1% |
| 11 |  Afghanistan Afghanistan |
43.8 | 76.9 | +33.0M | 75.4% |
| 12 |  Zambia Zambia |
21.9 | 38.1 | +16.2M | 73.8% |
| 13 |  Cameroon Cameroon |
29.9 | 51.1 | +21.2M | 71.0% |
| 14 |  Cote d’Ivoire Cote d’Ivoire |
32.7 | 55.7 | +23.0M | 70.4% |
| 15 |  Yemen Yemen |
41.8 | 71 | +29.2M | 69.9% |
| 16 |  Congo Congo |
6.5 | 11 | +4.5M | 69.7% |
| 17 |  Malawi Malawi |
22.2 | 37.4 | +15.1M | 68.2% |
| 18 |  Burundi Burundi |
14.4 | 24.1 | +9.7M | 67.7% |
| 19 |  Uganda Uganda |
51.4 | 85.4 | +34.0M | 66.3% |
| 20 |  Ethiopia Ethiopia |
135.5 | 225 | +89.5M | 66.1% |
| 21 |  Sudan Sudan |
51.7 | 85.2 | +33.5M | 64.9% |
| 22 |  Benin Benin |
14.8 | 24.4 | +9.6M | 64.9% |
| 23 |  Madagascar Madagascar |
32.7 | 53.2 | +20.4M | 62.4% |
| 24 |  Equatorial Guinea Equatorial Guinea |
1.9 | 3.1 | +1.2M | 62.2% |
| 25 |  Senegal Senegal |
18.9 | 30.4 | +11.4M | 60.4% |
| 26 |  Togo Togo |
9.7 | 15.6 | +5.9M | 60.3% |
| 27 |  Vanuatu Vanuatu |
0.3 | 0.5 | +199K | 59.4% |
| 28 |  Eritrea Eritrea |
3.6 | 5.7 | +2.1M | 57.9% |
| 29 |  Gabon Gabon |
2.6 | 4.1 | +1.5M | 57.5% |
| 30 |  Solomon Islands Solomon Islands |
0.8 | 1.3 | +470K | 56.1% |
| 31 |  Rwanda Rwanda |
14.6 | 22.7 | +8.1M | 55.9% |
| 32 |  Liberia Liberia |
5.7 | 8.9 | +3.2M | 55.5% |
| 33 |  Burkina Faso Burkina Faso |
24.1 | 37.3 | +13.2M | 55.0% |
| 34 |  Guinea Guinea |
15.1 | 23.4 | +8.3M | 55.0% |
| 35 |  Iraq Iraq |
47 | 71.9 | +24.9M | 53.0% |
| 36 |  Guinea-Bissau Guinea-Bissau |
2.2 | 3.4 | +1.2M | 52.9% |
| 37 |  Zimbabwe Zimbabwe |
17 | 25.9 | +8.9M | 52.6% |
| 38 |  Gambia Gambia |
2.8 | 4.3 | +1.5M | 52.4% |
| 39 |  Sao Tome and Principe Sao Tome and Principe |
0.2 | 0.4 | +125K | 52.0% |
| 40 |  Nigeria Nigeria |
237.5 | 359.2 | +121.7M | 51.2% |
| 41 |  Palestine Palestine |
5.6 | 8.5 | +2.9M | 51.2% |
| 42 |  South Sudan South Sudan |
12.2 | 18.3 | +6.2M | 50.5% |
| 43 |  Comoros Comoros |
0.9 | 1.3 | +425K | 48.1% |
| 44 |  Syria Syria |
25.6 | 37.8 | +12.2M | 47.5% |
| 45 |  Sierra Leone Sierra Leone |
8.8 | 12.9 | +4.1M | 46.8% |
| 46 |  Namibia Namibia |
3.1 | 4.5 | +1.4M | 45.9% |
| 47 |  Pakistan Pakistan |
255.2 | 371.9 | +116.6M | 45.7% |
| 48 |  Kenya Kenya |
57.5 | 83.6 | +26.1M | 45.3% |
| 49 |  Tajikistan Tajikistan |
10.8 | 15.6 | +4.8M | 44.4% |
| 50 |  Ghana Ghana |
35.1 | 50.6 | +15.5M | 44.2% |
| 51 |  Vatican City Vatican City |
0.001 | 0.001 | 213 | 42.5% |
| 52 |  Oman Oman |
5.5 | 7.8 | +2.3M | 42.4% |
| 53 |  Jordan Jordan |
11.5 | 16.4 | +4.8M | 42.1% |
| 54 |  Uzbekistan Uzbekistan |
37.1 | 52.2 | +15.2M | 40.9% |
| 55 |  Papua New Guinea Papua New Guinea |
10.8 | 14.9 | +4.1M | 38.5% |
| 56 |  Saudi Arabia Saudi Arabia |
34.6 | 47.7 | +13.1M | 38.0% |
| 57 |  Israel Israel |
9.5 | 13.1 | +3.6M | 37.6% |
| 58 |  Egypt Egypt |
118.4 | 161.6 | +43.3M | 36.6% |
| 59 |  United Arab Emirates United Arab Emirates |
11.3 | 15.4 | +4.0M | 35.4% |
| 60 |  Honduras Honduras |
11 | 14.8 | +3.8M | 34.9% |
| 61 |  Botswana Botswana |
2.6 | 3.4 | +875K | 34.2% |
| 62 |  Kiribati Kiribati |
0.1 | 0.2 | +46.1K | 33.8% |
| 63 |  Qatar Qatar |
3.1 | 4.2 | +1.0M | 33.7% |
| 64 |  Timor-Leste Timor-Leste |
1.4 | 1.9 | +471K | 33.2% |
| 65 |  Kyrgyzstan Kyrgyzstan |
7.3 | 9.6 | +2.3M | 32.2% |
| 66 |  Guatemala Guatemala |
18.7 | 24.7 | +6.0M | 32.0% |
| 67 |  Nauru Nauru |
0 | 0 | +3.7K | 31.0% |
| 68 |  Bahrain Bahrain |
1.6 | 2.1 | +496K | 30.2% |
| 69 |  Djibouti Djibouti |
1.2 | 1.5 | +346K | 29.3% |
| 70 |  Bolivia Bolivia |
12.6 | 16.1 | +3.5M | 28.0% |
| 71 |  Mongolia Mongolia |
3.5 | 4.5 | +984K | 28.0% |
| 72 |  Kazakhstan Kazakhstan |
20.8 | 26.5 | +5.7M | 27.3% |
| 73 |  Kuwait Kuwait |
5 | 6.4 | +1.3M | 26.7% |
| 74 |  Lesotho Lesotho |
2.4 | 3 | +630K | 26.6% |
| 75 |  Turkmenistan Turkmenistan |
7.6 | 9.6 | +2.0M | 26.5% |
| 76 |  Algeria Algeria |
47.4 | 59.6 | +12.1M | 25.6% |
| 77 |  Nicaragua Nicaragua |
7 | 8.8 | +1.7M | 25.0% |
| 78 |  Samoa Samoa |
0.2 | 0.3 | +53.4K | 24.4% |
| 79 |  Libya Libya |
7.5 | 9.3 | +1.8M | 24.2% |
| 80 |  Laos Laos |
7.9 | 9.8 | +1.9M | 23.9% |
| 81 |  Haiti Haiti |
11.9 | 14.7 | +2.8M | 23.6% |
| 82 |  Paraguay Paraguay |
7 | 8.6 | +1.6M | 23.2% |
| 83 |  Panama Panama |
4.6 | 5.6 | +1.1M | 23.2% |
| 84 |  Malaysia Malaysia |
36 | 44.3 | +8.3M | 23.1% |
| 85 |  Cambodia Cambodia |
17.8 | 21.9 | +4.1M | 22.9% |
| 86 |  South Africa South Africa |
64.7 | 79.2 | +14.4M | 22.3% |
| 87 |  Bangladesh Bangladesh |
175.7 | 214.7 | +39.0M | 22.2% |
| 88 |  Belize Belize |
0.4 | 0.5 | +93.7K | 22.2% |
| 89 |  Australia Australia |
27 | 32.5 | +5.5M | 20.5% |
| 90 |  Eswatini Eswatini |
1.3 | 1.5 | +249K | 19.8% |
| 91 |  Lebanon Lebanon |
5.8 | 7 | +1.1M | 19.7% |
| 92 |  Peru Peru |
34.6 | 40.6 | +6.0M | 17.4% |
| 93 |  Nepal Nepal |
29.6 | 34.6 | +5.0M | 17.0% |
| 94 |  Ecuador Ecuador |
18.3 | 21.3 | +3.0M | 16.7% |
| 95 |  Luxembourg Luxembourg |
0.7 | 0.8 | +111K | 16.3% |
| 96 |  Philippines Philippines |
116.8 | 134.4 | +17.6M | 15.1% |
| 97 |  India India |
1,463.90 | 1,679.60 | +215.7M | 14.7% |
| 98 |  Suriname Suriname |
0.6 | 0.7 | +94.1K | 14.7% |
| 99 |  Canada Canada |
40.1 | 45.6 | +5.5M | 13.7% |
| 100 |  Morocco Morocco |
38.4 | 43.4 | +5.0M | 13.0% |
| 101 |  Mexico Mexico |
131.9 | 148.9 | +17.0M | 12.9% |
| 102 |  Dominican Republic Dominican Republic |
11.5 | 13 | +1.5M | 12.8% |
| 103 |  Ireland Ireland |
5.3 | 6 | +662K | 12.5% |
| 104 |  Guyana Guyana |
0.8 | 0.9 | +105K | 12.5% |
| 105 |  Indonesia Indonesia |
285.7 | 320.7 | +35.0M | 12.2% |
| 106 |  Maldives Maldives |
0.5 | 0.6 | +60.3K | 11.4% |
| 107 |  Brunei Brunei |
0.5 | 0.5 | +53.2K | 11.4% |
| 108 |  Colombia Colombia |
53.4 | 59.4 | +6.0M | 11.2% |
| 109 |  Micronesia Micronesia |
0.1 | 0.1 | +12.7K | 11.2% |
| 110 |  Bhutan Bhutan |
0.8 | 0.9 | +85.7K | 10.8% |
| 111 |  Iran Iran |
92.4 | 101.9 | +9.4M | 10.2% |
| 112 |  Cyprus Cyprus |
1.4 | 1.5 | +138K | 10.0% |
| 113 |  United States United States |
347.3 | 380.8 | +33.6M | 9.7% |
| 114 |  New Zealand New Zealand |
5.3 | 5.8 | +503K | 9.6% |
| 115 |  Venezuela Venezuela |
28.5 | 31.1 | +2.6M | 9.0% |
| 116 |  Iceland Iceland |
0.4 | 0.4 | +34.7K | 8.7% |
| 117 |  United Kingdom United Kingdom |
69.6 | 75.5 | +6.0M | 8.6% |
| 118 |  Vietnam Vietnam |
101.6 | 110 | +8.4M | 8.3% |
| 119 |  Azerbaijan Azerbaijan |
10.4 | 11.2 | +827K | 8.0% |
| 120 |  Cabo Verde Cabo Verde |
0.5 | 0.6 | +38.8K | 7.4% |
| 121 |  Fiji Fiji |
0.9 | 1 | +67.1K | 7.2% |
| 122 |  Liechtenstein Liechtenstein |
0 | 0 | +2.9K | 7.2% |
| 123 |  Myanmar Myanmar |
54.9 | 58.6 | +3.8M | 6.9% |
| 124 |  Sri Lanka Sri Lanka |
23.2 | 24.8 | +1.6M | 6.8% |
| 125 |  Seychelles Seychelles |
0.1 | 0.1 | +9.0K | 6.8% |
| 126 |  Tunisia Tunisia |
12.3 | 13.1 | +797K | 6.5% |
| 127 |  Sweden Sweden |
10.7 | 11.3 | +653K | 6.1% |
| 128 |  Argentina Argentina |
45.9 | 48.3 | +2.5M | 5.4% |
| 129 |  Bahamas Bahamas |
0.4 | 0.4 | +21.2K | 5.3% |
| 130 |  Norway Norway |
5.6 | 5.9 | +277K | 4.9% |
| 131 |  El Salvador El Salvador |
6.4 | 6.7 | +298K | 4.7% |
| 132 |  Switzerland Switzerland |
9 | 9.3 | +375K | 4.2% |
| 133 |  Turkey Turkey |
87.7 | 91.3 | +3.6M | 4.1% |
| 134 |  Costa Rica Costa Rica |
5.2 | 5.4 | +201K | 3.9% |
| 135 |  Singapore Singapore |
5.9 | 6.1 | +211K | 3.6% |
| 136 |  Netherlands Netherlands |
18.3 | 19 | +612K | 3.3% |
| 137 |  Tuvalu Tuvalu |
0 | 0.01 | 289 | 3.0% |
| 138 |  France France |
66.7 | 68.2 | +1.6M | 2.4% |
| 139 |  Chile Chile |
19.9 | 20.3 | +460K | 2.3% |
| 140 |  Brazil Brazil |
212.8 | 217.5 | +4.7M | 2.2% |
| 141 |  Denmark Denmark |
6 | 6.1 | +122K | 2.0% |
| 142 |  Tonga Tonga |
0.1 | 0.1 | +1.5K | 1.4% |
| 143 |  Belgium Belgium |
11.8 | 11.9 | +112K | 1.0% |
| 144 |  Antigua and Barbuda Antigua and Barbuda |
0.1 | 0.1 | 846 | 0.9% |
| 145 |  San Marino San Marino |
0.034 | 0.034 | 124 | 0.4% |
| 146 |  Andorra Andorra |
0.083 | 0.082 | -709 | -0.9% |
| 147 |  Malta Malta |
0.55 | 0.54 | -9.7K | -1.8% |
| 148 |  North Korea North Korea |
26.6 | 25.8 | -784K | -3.0% |
| 149 |  Grenada Grenada |
0.12 | 0.11 | -4.1K | -3.5% |
| 150 |  Georgia Georgia |
3.8 | 3.7 | -143K | -3.7% |
| 151 |  Uruguay Uruguay |
3.4 | 3.3 | -130K | -3.9% |
| 152 |  Monaco Monaco |
0.04 | 0 | -1.6K | -4.1% |
| 153 |  Dominica Dominica |
0.07 | 0.06 | -2.7K | -4.1% |
| 154 |  Austria Austria |
9.1 | 8.7 | -389K | -4.3% |
| 155 |  Saint Lucia Saint Lucia |
0.18 | 0.17 | -8.1K | -4.5% |
| 156 |  Finland Finland |
5.6 | 5.4 | -272K | -4.8% |
| 157 |  Russia Russia |
144 | 136.1 | -7.9M | -5.5% |
| 158 |  Saint Kitts and Nevis Saint Kitts and Nevis |
0.05 | 0.04 | -2.7K | -5.7% |
| 159 |  Portugal Portugal |
10.4 | 9.8 | -642K | -6.2% |
| 160 |  Spain Spain |
47.9 | 44.9 | -3.0M | -6.2% |
| 161 |  Slovenia Slovenia |
2.1 | 2 | -136K | -6.4% |
| 162 |  Barbados Barbados |
0.28 | 0.26 | -18.4K | -6.5% |
| 163 |  Germany Germany |
84.1 | 78.3 | -5.8M | -6.9% |
| 164 |  Thailand Thailand |
71.6 | 66.4 | -5.2M | -7.3% |
| 165 |  Trinidad and Tobago Trinidad and Tobago |
1.5 | 1.4 | -111K | -7.4% |
| 166 |  Czechia Czechia |
10.6 | 9.8 | -784K | -7.4% |
| 167 |  Hungary Hungary |
9.6 | 8.7 | -907K | -9.4% |
| 168 |  Slovakia Slovakia |
5.5 | 4.9 | -538K | -9.8% |
| 169 |  Saint Vincent and the Grenadines Saint Vincent and the Grenadines |
0.1 | 0.09 | -11.0K | -11.0% |
| 170 |  China China |
1,416.10 | 1,260.30 | -155.8M | -11.0% |
| 171 |  Greece Greece |
9.9 | 8.8 | -1.1M | -11.3% |
| 172 |  Palau Palau |
0.02 | 0.02 | -2.1K | -12.1% |
| 173 |  Italy Italy |
59.1 | 51.9 | -7.3M | -12.3% |
| 174 |  Estonia Estonia |
1.3 | 1.2 | -170K | -12.6% |
| 175 |  South Korea South Korea |
51.7 | 45.1 | -6.5M | -12.6% |
| 176 |  Mauritius Mauritius |
1.3 | 1.1 | -161K | -12.7% |
| 177 |  Jamaica Jamaica |
2.8 | 2.5 | -382K | -13.5% |
| 178 |  Poland Poland |
38.1 | 32.8 | -5.3M | -14.0% |
| 179 |  Cuba Cuba |
10.9 | 9.4 | -1.6M | -14.2% |
| 180 |  Japan Japan |
123.1 | 105.1 | -18.0M | -14.6% |
| 181 |  Romania Romania |
18.9 | 16 | -2.9M | -15.2% |
| 182 |  Armenia Armenia |
3 | 2.5 | -457K | -15.5% |
| 183 |  Montenegro Montenegro |
0.63 | 0.53 | -99.4K | -15.7% |
| 184 |  Croatia Croatia |
3.8 | 3.2 | -614K | -16.0% |
| 185 |  North Macedonia North Macedonia |
1.8 | 1.5 | -301K | -16.6% |
| 186 |  Belarus Belarus |
9 | 7.5 | -1.5M | -17.2% |
| 187 |  Serbia Serbia |
6.7 | 5.5 | -1.2M | -17.3% |
| 188 |  Ukraine Ukraine |
39 | 32 | -7.0M | -17.9% |
| 189 |  Latvia Latvia |
1.9 | 1.5 | -340K | -18.3% |
| 190 |  Albania Albania |
2.8 | 2.2 | -531K | -19.2% |
| 191 |  Bulgaria Bulgaria |
6.7 | 5.4 | -1.3M | -19.5% |
| 192 |  Lithuania Lithuania |
2.8 | 2.3 | -571K | -20.2% |
| 193 |  Moldova Moldova |
3 | 2.4 | -644K | -21.5% |
| 194 |  Bosnia and Herzegovina Bosnia and Herzegovina |
3.1 | 2.5 | -685K | -21.8% |
| 195 |  Marshall Islands Marshall Islands |
0.04 | 0.03 | -11.1K | -30.6% |
All 10 of the fastest-growing sovereign states are in sub-Saharan Africa, where fertility remains high and child mortality has fallen sharply—a demographic lag that East Asia passed through decades ago.
This surge will place increasing pressure on infrastructure, education systems, and job markets, while also creating opportunities for economic expansion.
Where Populations Are Shrinking the Fastest
At the other end of the spectrum, several major economies are entering sustained population decline—driven by low birth rates and aging populations.
China alone is projected to lose more than 150 million people by 2050, while Japan, Italy, and Russia are also facing steep contractions. This shift could have significant implications for economic growth, labor supply, and public finances. Overall, European countries make up 11 of the 20 largest absolute declines.
Even Thailand is projected to shrink by 4.2 million people, highlighting how population decline is spreading beyond traditionally aging regions. Like many countries in East Asia, Thailand faces persistently low fertility rates (around 1.2 births per woman) and a rapidly aging population.
By mid-century, global population trends will be defined less by overall growth and more by divergence.
A small group of countries will account for the vast majority of new people, while many others shrink. This widening gap between fast-growing and shrinking populations is set to reshape migration flows, economic power, and the global workforce over the coming decades.
Learn More on the Voronoi App
To learn more about this topic, check out this graphic on the countries with the most births per hour.