Artificial intelligence is no longer just a story about models. It is also a story about infrastructure, chips, enterprise adoption, and the growing role AI is playing in how businesses operate and how content gets created.
For AI Week, we partnered with Terzo to explore the infrastructure, markets, and adoption patterns shaping the AI economy.
From hyperscaler spending to business usage and the rise of AI-generated content, the series revealed how quickly AI is reshaping business and technology. Below, we’ve compiled six key takeaways.
1. AI Usage by Businesses by State in 2026
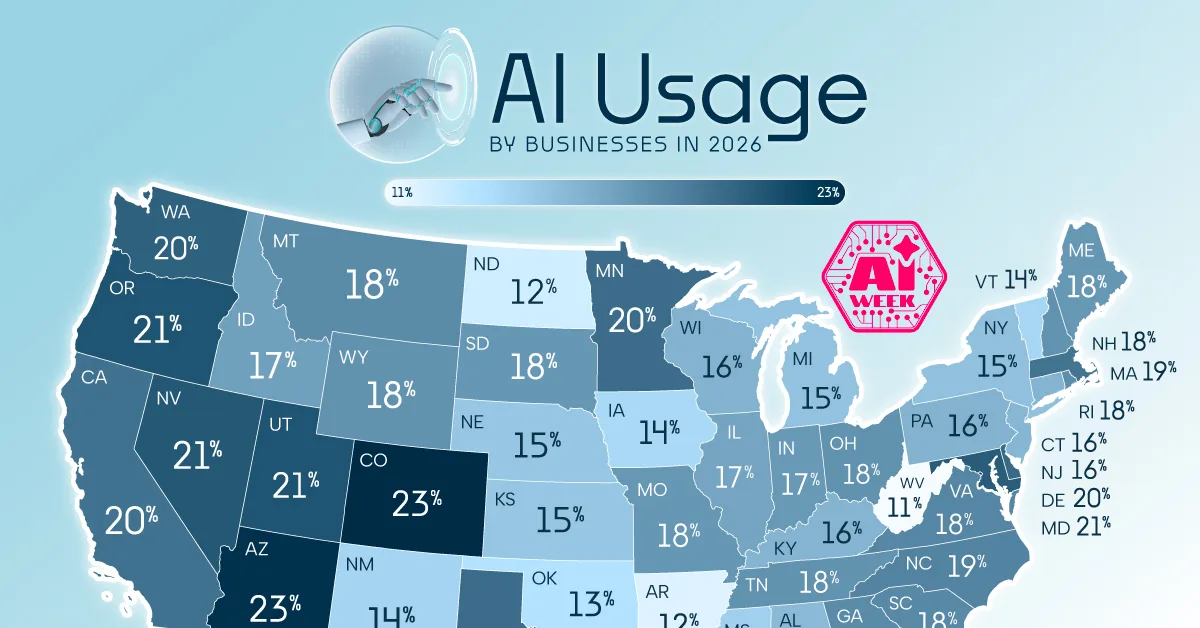
Geography still shapes technology adoption, and this map shows where businesses are using AI the most across America and how that usage varies from state to state.

2. AI Chip Sales by Company
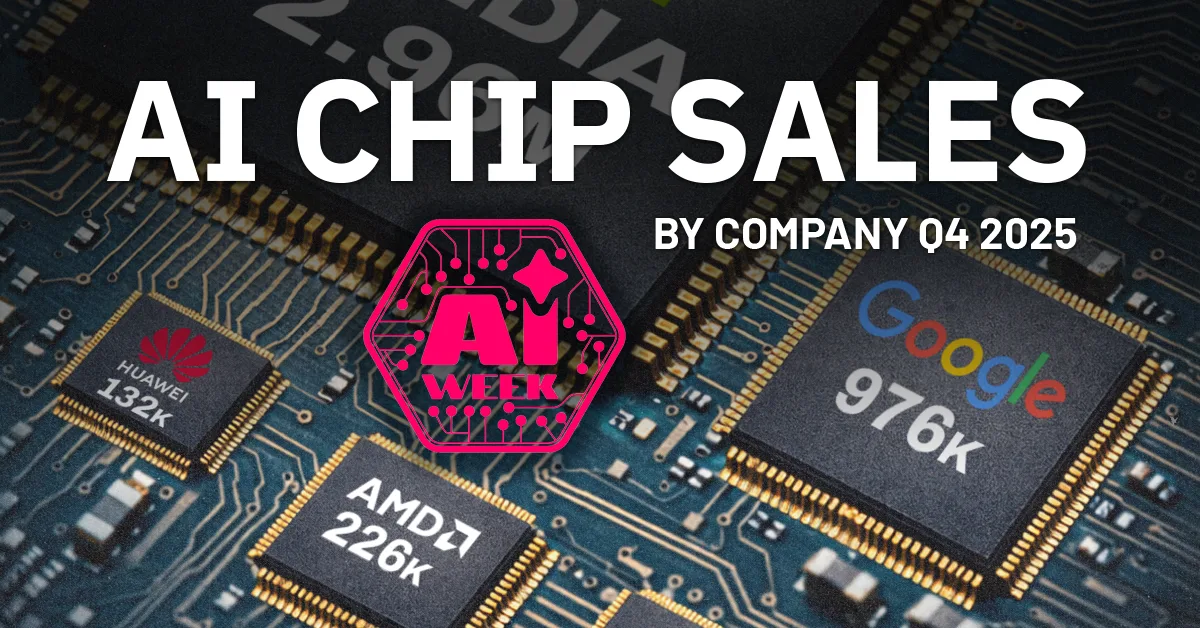
Behind every leading AI model is a massive amount of computing power, and this graphic compares the companies supplying that capacity with a financial lens.
3. Big Tech AI Spending Over Time
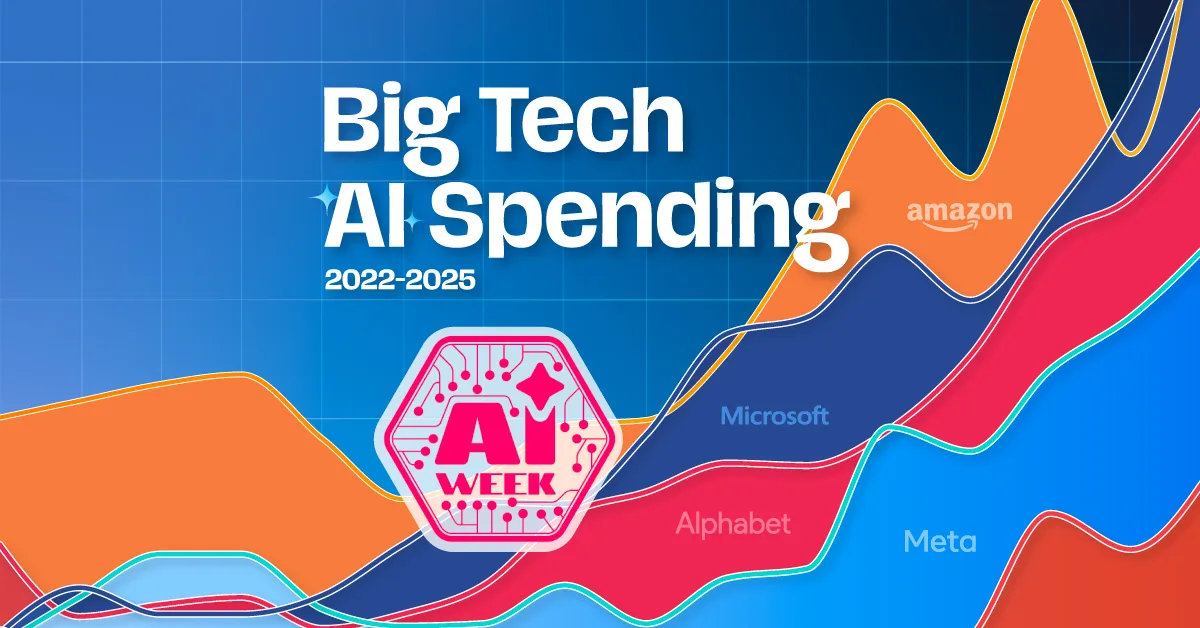
From cloud giants to data center buildouts, this graphic tracks how AI-driven capital spending has evolved across the biggest tech companies and why that surge matters for the future of infrastructure.
4. Which AI Models Are Businesses Paying For?
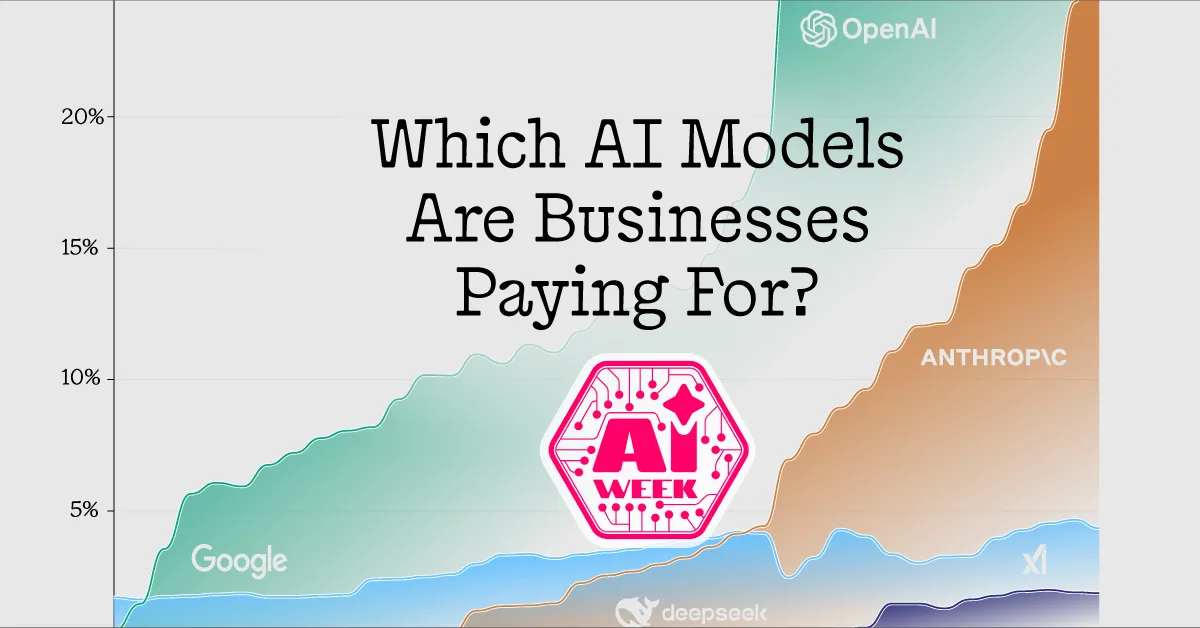
Using business payment data over time, this chart shows how the enterprise AI market is evolving and which model providers are gaining traction with paying customers.
5. The Smartest AI Models in 2026
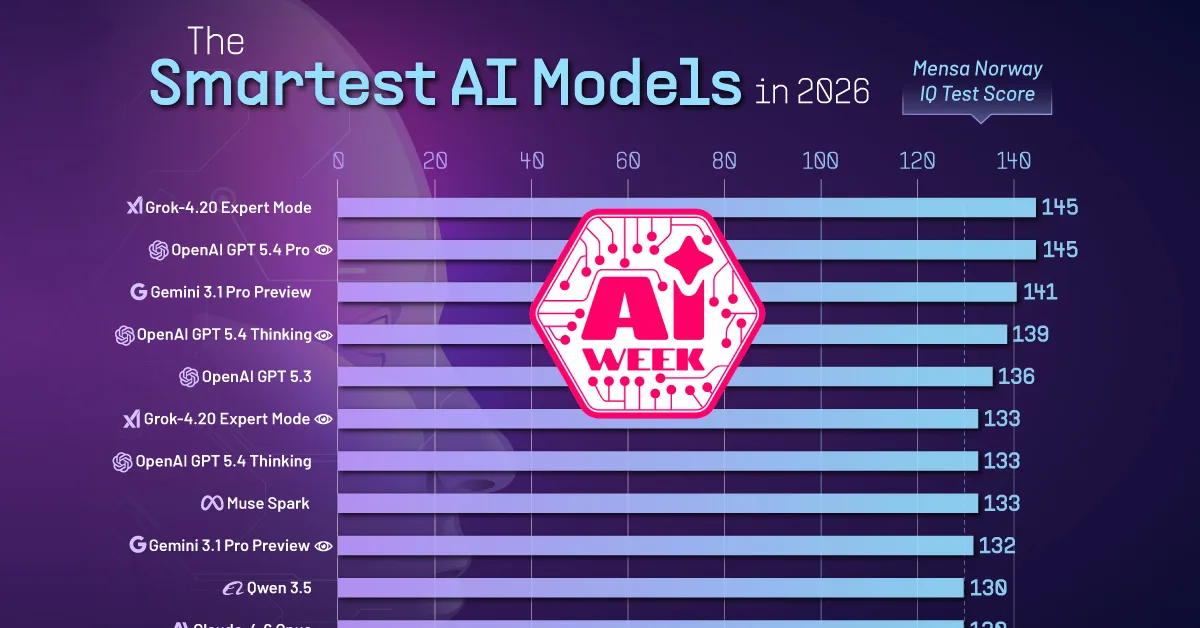
Measured against a well-known IQ-style benchmark, this ranking offers a snapshot of how leading AI models stack up on abstract reasoning tasks at this stage of the race.
6. Content Created by Humans vs. AI
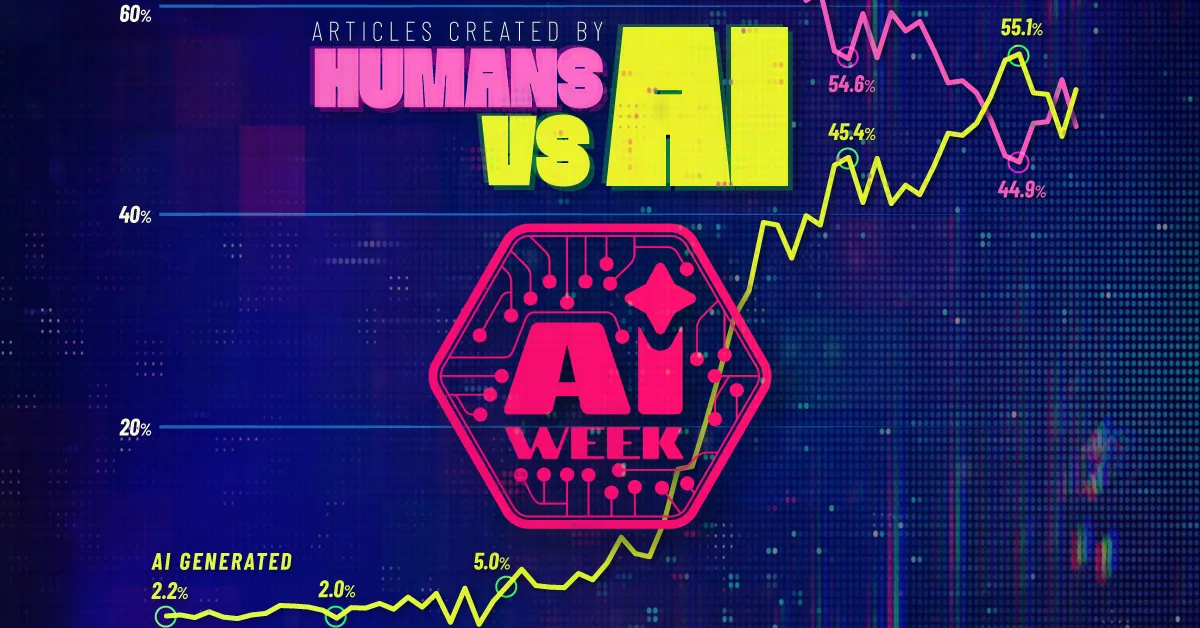
Online publishing is changing quickly, and this graphic shows how the balance between human- and AI-written articles has shifted over time in a large sample of web content.
Looking Ahead: The AI Economy Is Expanding Fast
Taken together, these visuals point to a larger trend: AI is no longer confined to research labs or product demos. It is now influencing how companies spend, how hardware markets are valued, how enterprises choose tools, and how digital content is produced.
Terzo is helping spotlight the data behind this shift through AI Week, our sponsored series on the infrastructure, markets, and adoption patterns shaping the next phase of artificial intelligence.