How Government Debt Has Diverged Across Major Economies
See visuals like this from many other data creators on our Voronoi app. Download it for free on iOS or Android and discover incredible data-driven charts from a variety of trusted sources.
Key Takeaways
- Government debt has diverged sharply across major economies since 2005.
- Several countries—including the U.S., UK, and France—now exceed 100% debt-to-GDP.
- Others, like Türkiye and Saudi Arabia, have reduced their debt burdens over the same period.
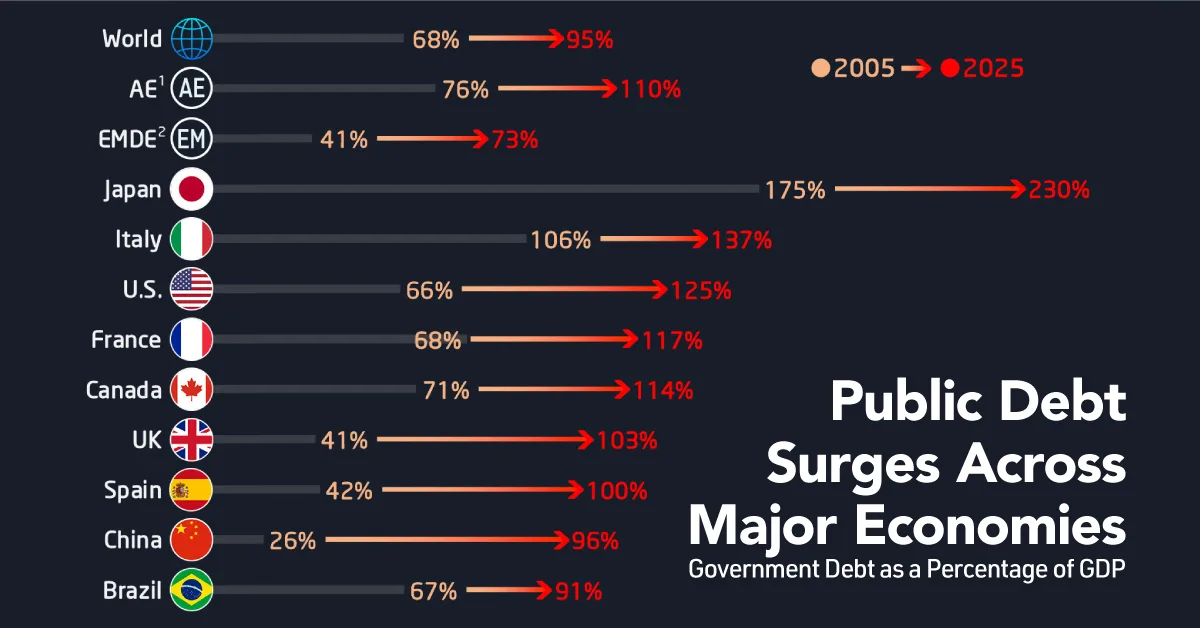
Government debt has taken very different paths across the world over the past two decades. While some countries have seen debt levels surge past 100% of GDP, others have stabilized or reduced their burdens.
This chart compares government debt as a share of GDP across major economies in 2005 and 2025, highlighting how fiscal trajectories have diverged over time. The data comes from the IMF’s October 2025 World Economic Outlook.
Debt Paths Are Splitting Across Economies
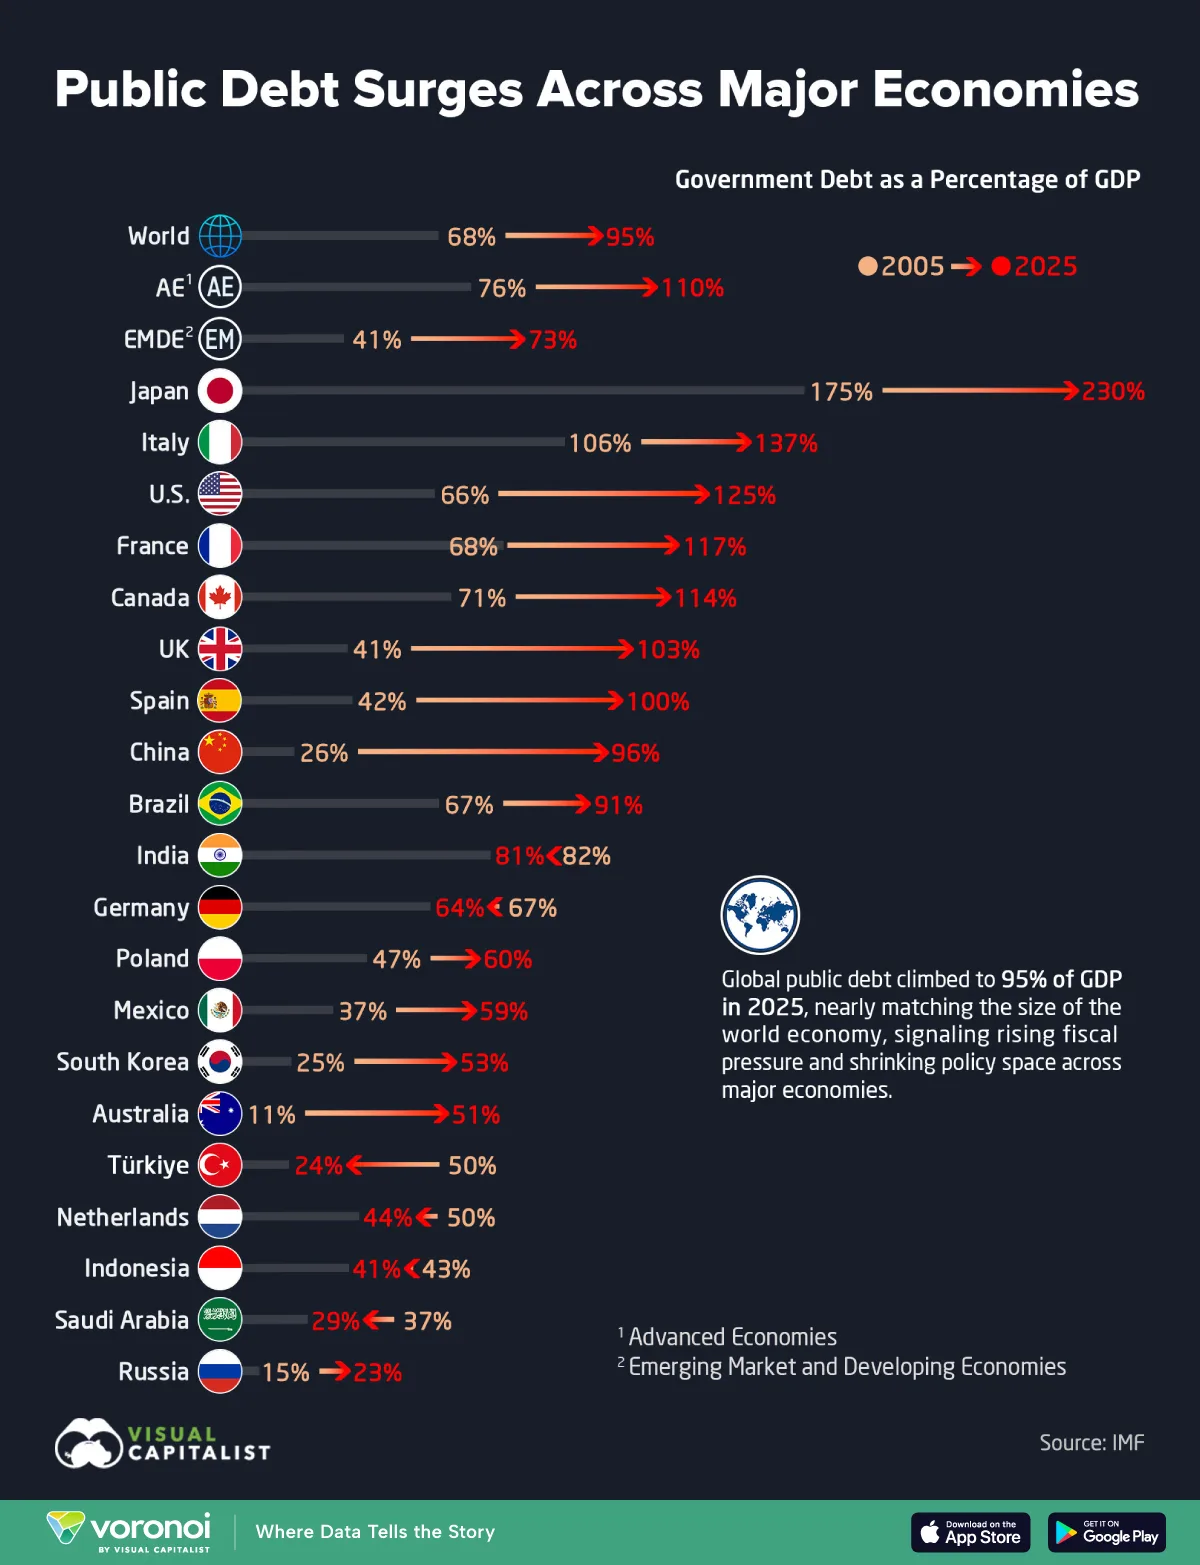
While global public debt has risen overall—from 68% to 95% of GDP—the headline number masks significant differences between countries. Some economies have seen rapid increases, while others have kept debt stable or reduced it.
| Country | Debt-to-GDP, 2005 | Debt-to-GDP, 2025 | Change (p.p.) |
|---|---|---|---|
 China China |
26% | 96% | +70 |
 UK UK |
41% | 103% | +62 |
 U.S. U.S. |
66% | 125% | +59 |
 Spain Spain |
42% | 100% | +58 |
 Japan Japan |
175% | 230% | +55 |
 France France |
68% | 117% | +49 |
 Canada Canada |
71% | 114% | +43 |
 Australia Australia |
11% | 51% | +40 |
 Italy Italy |
106% | 137% | +31 |
 South Korea South Korea |
25% | 53% | +28 |
 Brazil Brazil |
67% | 91% | +24 |
 Mexico Mexico |
37% | 59% | +22 |
 Poland Poland |
47% | 60% | +13 |
 Russia Russia |
15% | 23% | +8 |
 India India |
82% | 81% | -1 |
 Indonesia Indonesia |
43% | 41% | -2 |
 Germany Germany |
67% | 64% | -3 |
 Netherlands Netherlands |
50% | 44% | -6 |
 Saudi Arabia Saudi Arabia |
37% | 29% | -8 |
 Türkiye Türkiye |
50% | 24% | -26 |
| Advanced economies | 76% | 110% | +34 |
| Emerging market and developing economies | 41% | 73% | +32 |
 World World |
68% | 95% | +27 |
Advanced Economies Lead the Surge
Debt levels in advanced economies rose from 76% to 110% of GDP over the period.
The United States (125%), France (117%), and the United Kingdom (103%) have all crossed the 100% threshold. Japan remains an outlier, with debt reaching 230% of GDP, the highest among major economies. These elevated levels reflect aging populations, persistent deficits, and large-scale stimulus efforts.
Emerging markets and developing economies saw debt rise from 41% to 73% of GDP. China’s debt jumped sharply from 26% to 96%, while Brazil and South Africa also saw notable increases.
Despite the overall upward trend, a number of countries have moved in the opposite direction. Türkiye and Saudi Arabia both reduced their debt-to-GDP ratios, showing that fiscal consolidation is still achievable under the right conditions.
As borrowing costs rise and growth slows in many regions, these diverging debt paths are likely to become even more consequential.
Learn More on the Voronoi App 
If you enjoyed today’s post, check out Global Broad Money Supply Reaches $144 Trillion in 2025 on Voronoi, the app from Visual Capitalist.