Mapped: The World’s Top Innovation Clusters
See visuals like this from many other data creators on our Voronoi app. Download the app for free on iOS or Android and discover data-driven charts from a variety of trusted sources.
Key Takeaways:
- China hosts 24 of the world’s top 100 innovation clusters, surpassing the U.S. (22) for the largest number of leading hubs.
- The world’s top 10 innovation clusters generate nearly 40% of global patent filings, showing how concentrated global innovation has become.
- Just 33 economies account for all 100 leading clusters, which together represent roughly 70% of global patent applications and venture capital activity.
Innovation is often discussed at the national level, but breakthrough technologies tend to emerge from smaller geographic hubs where researchers, startups, investors, and established companies interact closely.
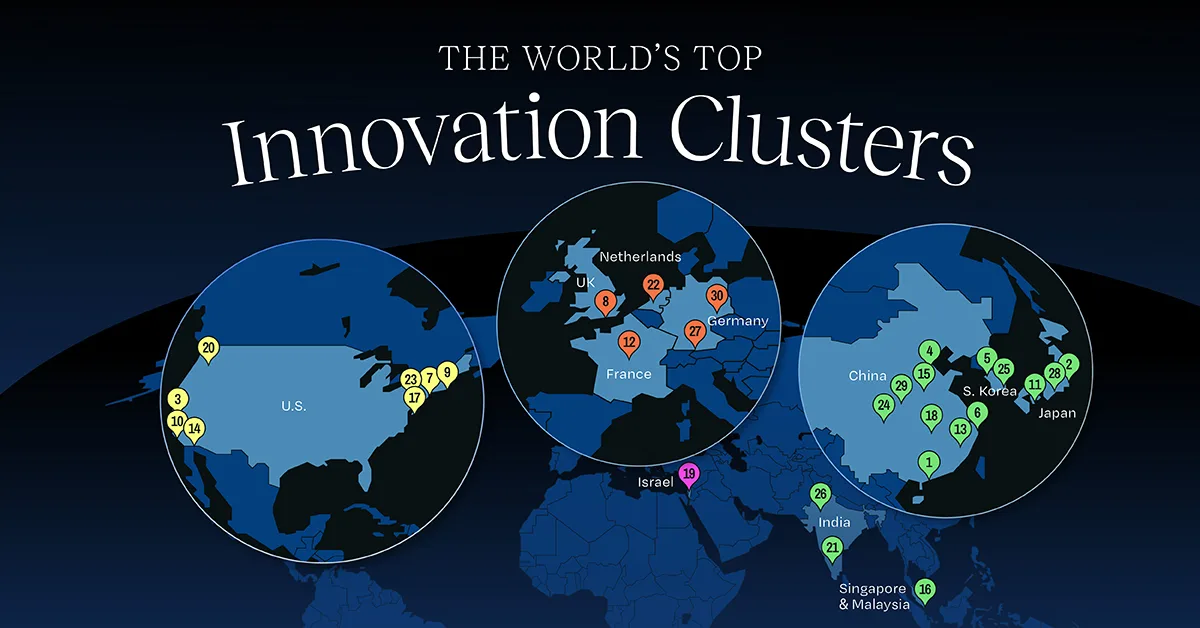
Using data from the World Intellectual Property Organization’s (WIPO) Global Innovation Index 2025, this graphic ranks the world’s top innovation clusters based on scientific publications, international patent filings, and venture capital activity.
The rankings highlight where research, capital, and entrepreneurship are combining to create the world’s most influential innovation ecosystems.
Where Are the World’s Top Innovation Clusters?
The table below shows the world’s leading innovation clusters according to WIPO’s 2025 rankings.
| Rank | Innovation Cluster | Country |
|---|---|---|
| 1 | Shenzhen–Hong Kong–Guangzhou |   China / Hong Kong China / Hong Kong |
| 2 | Tokyo–Yokohama |  Japan Japan |
| 3 | San Jose–San Francisco |  United States United States |
| 4 | Beijing | China |
| 5 | Seoul |  South Korea South Korea |
| 6 | Shanghai–Suzhou | China |
| 7 | New York City | United States |
| 8 | London |  United Kingdom United Kingdom |
| 9 | Boston–Cambridge | United States |
| 10 | Los Angeles | United States |
| 11 | Osaka–Kobe–Kyoto | Japan |
| 12 | Paris |  France France |
| 13 | Hangzhou | China |
| 14 | San Diego | United States |
| 15 | Nanjing | China |
| 16 | Singapore |   Singapore / Malaysia Singapore / Malaysia |
| 17 | Washington–Baltimore | United States |
| 18 | Wuhan | China |
| 19 | Tel Aviv–Jerusalem |  Israel Israel |
| 20 | Seattle | United States |
| 21 | Bengaluru |  India India |
| 22 | Amsterdam–Rotterdam |  Netherlands Netherlands |
| 23 | Philadelphia | United States |
| 24 | Chengdu | China |
| 25 | Daejeon | South Korea |
| 26 | Delhi | India |
| 27 | Munich |  Germany Germany |
| 28 | Nagoya | Japan |
| 29 | Xi’an | China |
| 30 | Berlin | Germany |
| 31 | Chicago | United States |
| 32 | Stockholm |  Sweden Sweden |
| 33 | Toronto |  Canada Canada |
| 34 | Qingdao | China |
| 35 | Denver | United States |
| 36 | Sydney |  Australia Australia |
| 37 | Austin | United States |
| 38 | Houston | United States |
| 39 | Hefei | China |
| 40 | Zürich |  Switzerland Switzerland |
| 41 | Taipei–Hsinchu |  Taiwan* Taiwan* |
| 42 | Copenhagen |  Denmark Denmark |
| 43 | Cologne | Germany |
| 44 | Changsha | China |
| 45 | Barcelona |  Spain Spain |
| 46 | Mumbai | India |
| 47 | Madrid | Spain |
| 48 | Moscow |  Russia Russia |
| 49 | São Paulo |  Brazil Brazil |
| 50 | Tianjin | China |
| 51 | Minneapolis | United States |
| 52 | Melbourne | Australia |
| 53 | Raleigh | United States |
| 54 | Stuttgart | Germany |
| 55 | Brussels–Antwerp |  Belgium Belgium |
| 56 | Milan |  Italy Italy |
| 57 | Chongqing | China |
| 58 | Istanbul |  Turkey Turkey |
| 59 | Atlanta | United States |
| 60 | Helsinki |  Finland Finland |
| 61 | Dallas | United States |
| 62 | Montréal | Canada |
| 63 | Tehran |  Iran Iran |
| 64 | Frankfurt am Main | Germany |
| 65 | Eindhoven | Netherlands |
| 66 | Vancouver | Canada |
| 67 | Miami | United States |
| 68 | Jinan | China |
| 69 | Cambridge | United Kingdom |
| 70 | Harbin | China |
| 71 | Dublin |  Ireland Ireland |
| 72 | Changchun | China |
| 73 | Portland | United States |
| 74 | Vienna |  Austria Austria |
| 75 | Shenyang | China |
| 76 | Pittsburgh | United States |
| 77 | Oxford | United Kingdom |
| 78 | Phoenix | United States |
| 79 | Mexico City |  Mexico Mexico |
| 80 | Zhengzhou | China |
| 81 | Xiamen | China |
| 82 | Rome | Italy |
| 83 | Cairo |  Egypt Egypt |
| 84 | Chennai | India |
| 85 | Oslo |  Norway Norway |
| 86 | Kuala Lumpur | Malaysia |
| 87 | Heidelberg–Mannheim | Germany |
| 88 | Dalian | China |
| 89 | Warsaw |  Poland Poland |
| 90 | Lyon | France |
| 91 | Hamburg | Germany |
| 92 | Salt Lake City | United States |
| 93 | Ningbo | China |
| 94 | Manchester | United Kingdom |
| 95 | Busan | South Korea |
| 96 | Ann Arbor | United States |
| 97 | Göteborg | Sweden |
| 98 | Macau–Zhuhai | China |
| 99 | Ningde | China |
| 100 | Zhenjiang | China |
China and the U.S. dominate the rankings, while innovation hotspots in Japan, South Korea, Europe, and India also feature prominently.
Shenzhen–Hong Kong–Guangzhou claims the top spot globally, followed by Tokyo–Yokohama and Silicon Valley’s San Jose–San Francisco corridor.
Unlike city rankings, WIPO’s clusters often span multiple metropolitan areas and even national borders. The organization uses a bottom-up methodology that identifies regions with dense concentrations of inventors and scientific authors, rather than relying on political boundaries. As a result, clusters often represent entire innovation ecosystems rather than individual cities.
The Concentration of Innovation
Innovation clusters emerge because talent, capital, and institutions tend to reinforce one another. Leading research universities attract scientists, successful startups attract investors, and large technology firms create opportunities for commercialization. Over time, these advantages compound.
This dynamic helps explain why a handful of regions consistently dominate global innovation. Silicon Valley benefits from world-class universities, deep venture capital markets, and a culture of entrepreneurship. Similarly, China’s leading clusters have been supported by sustained investment in research, advanced manufacturing, and technology commercialization.
The concentration of innovation has become an increasingly important factor in global economic competition. Recent analysis from Foreign Affairs argues that technological leadership is now a central pillar of geopolitical power, while research from CSIS highlights how government-supported R&D ecosystems can accelerate innovation capacity.
China’s Rise Reshapes the Innovation Map
One of the most notable trends in recent years has been the rapid rise of Chinese innovation clusters. Shenzhen–Hong Kong–Guangzhou now ranks as the world’s leading cluster, while Beijing and Shanghai–Suzhou also place among the global elite. China hosts more top-100 clusters than any other economy.
At the same time, the U.S. remains a dominant force in commercialization and venture capital. New York, Los Angeles, Boston, Seattle, and Silicon Valley continue to rank among the world’s most influential innovation ecosystems. In areas such as artificial intelligence innovation, American clusters continue to attract a disproportionate share of global investment and entrepreneurial activity.
Learn More on the Voronoi App 
To see how innovation leadership has evolved over centuries, and what today’s leading clusters might signal about the future, check out Long Waves: The History of Innovation Cycles on the Voronoi app.