Mapped: Income Needed to Live Comfortably in U.S. Cities
See visuals like this from many other data creators on our Voronoi app. Download it for free on iOS or Android and discover incredible data-driven charts from a variety of trusted sources.
Key Takeaways
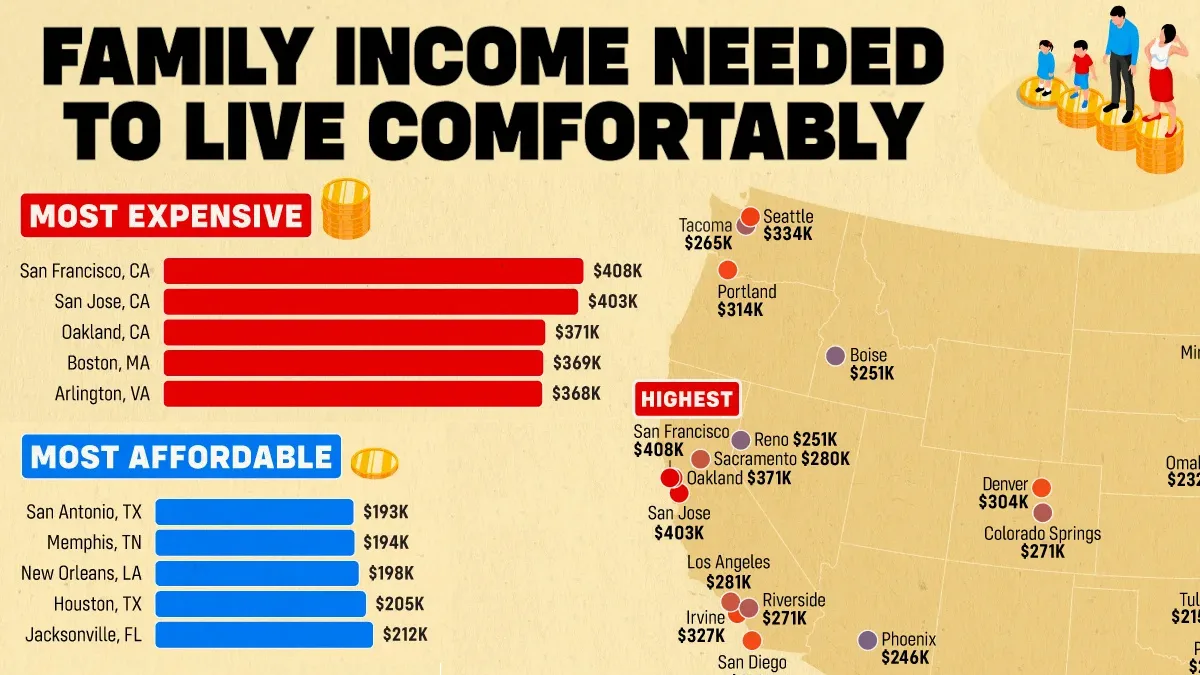
- A family of four needs more than $400,000 annually to live comfortably in both San Francisco and San Jose.
- California is home to six of the 10 highest-income cities in the ranking.
- Even the most affordable city analyzed still requires nearly $200,000 under the 50/30/20 budgeting rule.
This map ranks 56 major U.S. cities by the annual income a family of four needs to live comfortably.
Using data from SmartAsset, based on the MIT Living Wage Calculator updated in February 2026, the estimates apply the 50/30/20 budgeting framework: 50% of income for necessities, 30% for discretionary spending, and 20% for savings.
The results highlight how much the cost of maintaining the same standard of living varies across the country.
Bay Area Cities Lead the Ranking
San Francisco tops the ranking, with a family of four needing about $408,000 annually to live comfortably.
Nearby San Jose follows at roughly $403,000, while Oakland ranks third at $371,000.
| Rank | City | Family Income Need to Live Confortably |
|---|---|---|
| 1 | San Francisco, CA | $407,597 |
| 2 | San Jose, CA | $402,771 |
| 3 | Oakland, CA | $371,488 |
| 4 | Boston, MA | $368,742 |
| 5 | Arlington, VA | $368,326 |
| 6 | New York, NY | $337,875 |
| 7 | Seattle, WA | $334,131 |
| 8 | Irvine, CA | $327,226 |
| 9 | Honolulu, HI | $321,069 |
| 10 | Washington, DC | $319,405 |
| 11 | Portland, OR | $313,747 |
| 12 | San Diego, CA | $312,915 |
| 13 | Denver, CO | $303,514 |
| 14 | Jersey City, NJ | $297,606 |
| 15 | Minneapolis, MN | $288,787 |
| 16 | Anchorage, AK | $285,210 |
| 17 | Los Angeles, CA | $281,466 |
| 18 | Sacramento, CA | $279,802 |
| 19 | Newark, NJ | $278,221 |
| 20 | St. Paul, MN | $278,221 |
| 21 | Riverside, CA | $270,566 |
| 22 | Colorado Springs, CO | $270,566 |
| 23 | Tacoma, WA | $264,742 |
| 24 | Madison, WI | $263,245 |
| 25 | Philadelphia, PA | $252,845 |
| 26 | Reno, NV | $251,264 |
| 27 | Boise, ID | $251,181 |
| 28 | Raleigh, NC | $249,434 |
| 29 | Buffalo, NY | $247,853 |
| 30 | Indianapolis, IN | $247,021 |
| 31 | Phoenix, AZ | $245,523 |
| 32 | Chicago, IL | $242,278 |
| 33 | Charlotte, NC | $241,446 |
| 34 | Pittsburgh, PA | $238,534 |
| 35 | Columbus, OH | $238,534 |
| 36 | Durham, NC | $237,619 |
| 37 | Virginia Beach, VA | $237,702 |
| 38 | Atlanta, GA | $232,378 |
| 39 | Omaha, NE | $232,294 |
| 40 | Miami, FL | $231,130 |
| 41 | Kansas City, MO | $230,131 |
| 42 | Plano, TX | $230,464 |
| 43 | Austin, TX | $229,050 |
| 44 | Tampa, FL | $226,720 |
| 45 | Baltimore, MD | $224,224 |
| 46 | Richmond, VA | $223,974 |
| 47 | Fort Worth, TX | $217,235 |
| 48 | Tulsa, OK | $215,238 |
| 49 | Dallas, TX | $214,490 |
| 50 | Orlando, FL | $214,157 |
| 51 | Nashville, TN | $213,408 |
| 52 | Jacksonville, FL | $211,578 |
| 53 | Houston, TX | $204,672 |
| 54 | New Orleans, LA | $197,766 |
| 55 | Memphis, TN | $193,939 |
| 56 | San Antonio, TX | $192,608 |
High housing costs are the biggest driver behind these income requirements. California dominates the top of the ranking, with six cities appearing among the 10 most expensive places for families.
The Northeast and Pacific Coast Remain Costly
Boston, Arlington, New York, Seattle, Honolulu, and Washington, D.C. also rank among the most expensive cities.
These metro areas combine high housing costs with above-average expenses for transportation, childcare, and other necessities.
Many of these cities also offer higher wages than the national average, but elevated living costs often offset those income gains.
Southern Cities Offer Lower Income Thresholds
The lowest income requirements are concentrated in the South.
San Antonio ranks last, requiring about $193,000 for a family of four to live comfortably, followed by Memphis, New Orleans, and Houston.
The ranking highlights how expensive “living comfortably” has become across the United States. Under the 50/30/20 budgeting framework, every metro area analyzed requires a six-figure household income, with the highest-cost cities demanding more than $400,000 per year.
Learn More on the Voronoi App 
If you enjoyed today’s post, check out The States Where Housing Prices Have Surged the Most (2021–2026) on Voronoi.