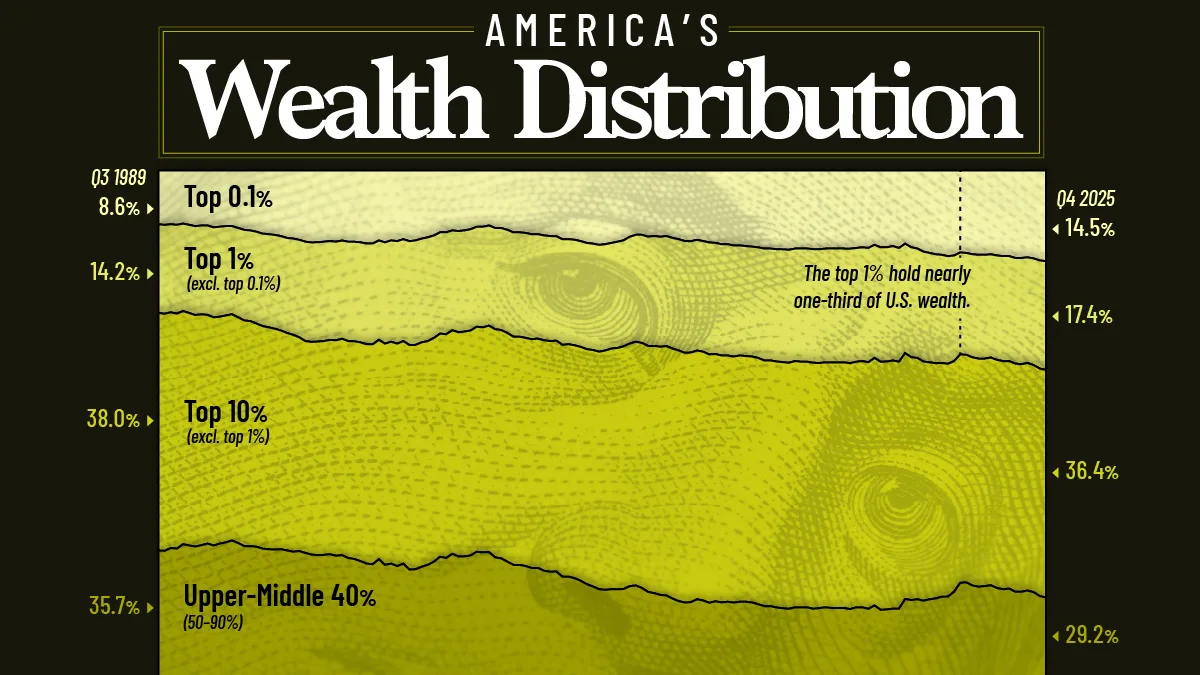
How America’s Wealth Distribution Has Changed Since 1989
See visuals like this from many other data creators on our Voronoi app. Download it for free on iOS or Android and discover incredible data-driven charts from a variety of trusted sources.
Key Takeaways
- The top 1% of U.S. households now own 31.9% of all household wealth, more than the combined share of the bottom 90%.
- Over the last 36 years, every wealth segment outside of the top 1% lost share, while the top 1% saw its share increase.
Wealth reflects the value of everything households own, including homes, stocks, businesses, and savings, minus what they owe.
Because different wealth groups own very different mixes of assets, long-term market trends can reshape how the nation’s wealth is divided.
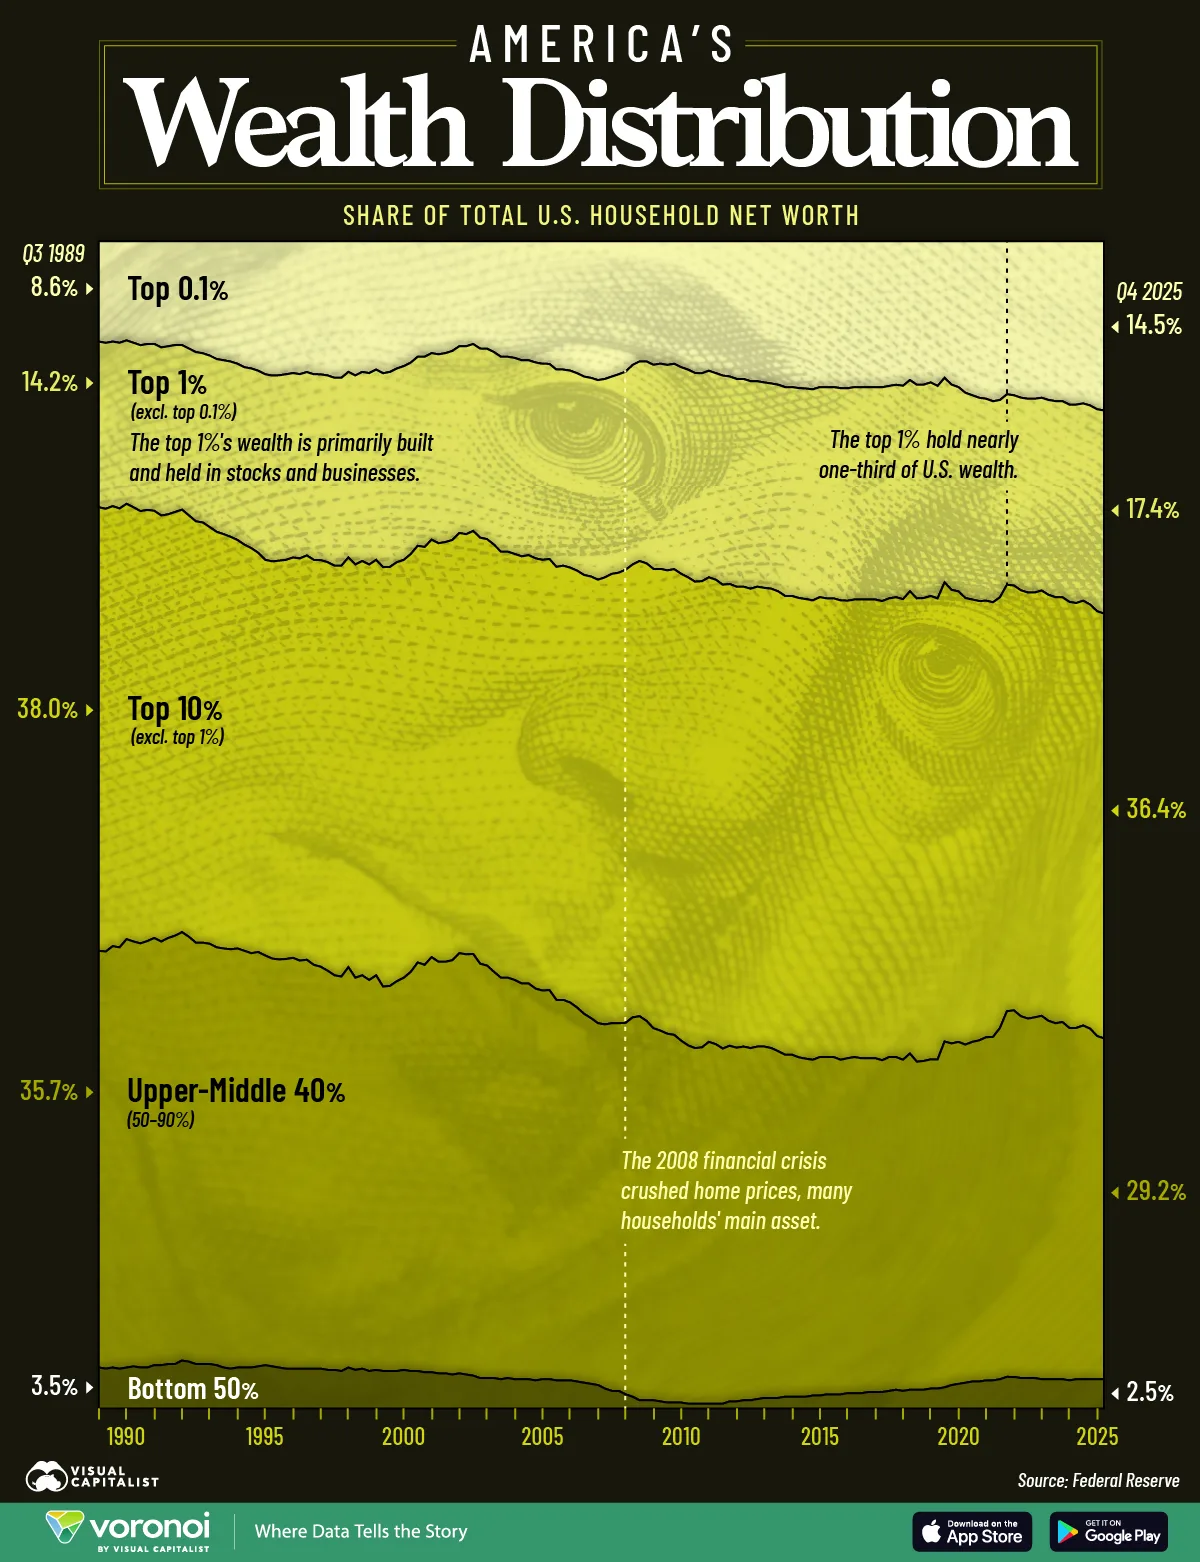
This graphic tracks how U.S. household wealth has shifted across wealth groups from Q3 1989 to Q4 2025 using data from the Federal Reserve’s Distributional Financial Accounts.
Wealth of the Top 1% vs. the Bottom 90%
The table below shows how the wealth distribution has changed over the last 35 years:
| U.S. Wealth Segment | Share of Total Household Net Worth (Q3 1989) |
Share of Total Household Net Worth (Q4 2025) |
Change (Percentage Points) |
|---|---|---|---|
| Top 0.1% | 8.6% | 14.5% | +5.9 points |
| Top 1.0% (excl. top 0.1%) | 14.2% | 17.4% | +3.2 points |
| Top 10% (excl. top 1%) | 38.0% | 36.4% | -1.6 points |
| Upper Middle 40% | 35.7% | 29.2% | -6.5 points |
| Bottom 50% | 3.5% | 2.5% | -1.0 points |
The top 1% built its wealth primarily through stocks and businesses, assets that have soared in value for decades. In fact, every group below the top 1% has lost share since 1989: even the next 9% of households, from the 90th to 99th percentiles, slipped from 38.0% to 36.4%.
Wealth further down the ladder is tied mostly to the family home, which appreciates far more slowly than the stock market. Much of the bottom 50%’s net worth is home equity, and many households in that group have little or no net worth at all. That’s why the gap between the top and the bottom has widened over the last 36 years.
How Markets Move Each Group’s Share
Market swings move each group’s share differently, depending on the assets its households own.
Every boom rewards whoever holds financial assets, and those gains compound: between 1989 and 2025, the top 0.1% increased its share of household wealth from 8.6% to 14.5%, while the top 1% as a whole climbed from 22.8% to 31.9%.
Busts fall hardest on those with the least cushion. The 2008 housing crash crushed the value of ordinary households’ main asset, and the bottom 50%’s share eventually fell to a record low of 0.4% before recovering to 2.5% today.
Over the full period, no group lost more ground than the upper-middle 40%, households between the 50th and 90th percentiles, whose share slid from 35.7% to 29.2% as home values trailed the stock market.
Wealth Distribution by Income Segment (1989-2025)
See all the data for the last 36 years below:
| Time Period | Top 0.1% | Top 1% (excl. top 0.1%) |
Top 10% (excl. top 1%) |
Upper-Middle 40% (excl. top 10%) |
Bottom 50% |
|---|---|---|---|---|---|
| Q3 1989 | 8.6% | 14.2% | 38.0% | 35.7% | 3.5% |
| Q4 1989 | 8.7% | 14.2% | 37.9% | 35.7% | 3.4% |
| Q1 1990 | 8.6% | 14.1% | 37.7% | 36.1% | 3.5% |
| Q2 1990 | 8.7% | 14.2% | 37.6% | 36.1% | 3.4% |
| Q3 1990 | 8.5% | 14.0% | 37.3% | 36.7% | 3.5% |
| Q4 1990 | 8.7% | 14.1% | 37.2% | 36.4% | 3.6% |
| Q1 1991 | 8.9% | 14.2% | 37.0% | 36.3% | 3.5% |
| Q2 1991 | 8.8% | 14.2% | 36.9% | 36.5% | 3.5% |
| Q3 1991 | 8.8% | 14.3% | 36.6% | 36.6% | 3.7% |
| Q4 1991 | 9.1% | 14.4% | 36.5% | 36.3% | 3.7% |
| Q1 1992 | 9.0% | 14.4% | 36.3% | 36.5% | 3.8% |
| Q2 1992 | 8.9% | 14.3% | 36.3% | 36.7% | 3.8% |
| Q3 1992 | 8.9% | 14.1% | 36.2% | 36.7% | 4.1% |
| Q4 1992 | 9.2% | 14.3% | 36.1% | 36.4% | 4.0% |
| Q1 1993 | 9.5% | 14.5% | 36.1% | 36.1% | 3.8% |
| Q2 1993 | 9.6% | 14.5% | 36.0% | 36.1% | 3.8% |
| Q3 1993 | 9.8% | 14.7% | 35.7% | 36.0% | 3.8% |
| Q4 1993 | 10.1% | 14.8% | 35.6% | 35.8% | 3.7% |
| Q1 1994 | 10.2% | 14.9% | 35.5% | 35.9% | 3.5% |
| Q2 1994 | 10.3% | 15.0% | 35.3% | 35.9% | 3.4% |
| Q3 1994 | 10.5% | 15.1% | 35.0% | 35.9% | 3.5% |
| Q4 1994 | 10.8% | 15.2% | 34.8% | 35.7% | 3.5% |
| Q1 1995 | 10.9% | 15.4% | 34.7% | 35.5% | 3.5% |
| Q2 1995 | 11.1% | 15.6% | 34.2% | 35.5% | 3.6% |
| Q3 1995 | 11.4% | 15.9% | 33.9% | 35.1% | 3.7% |
| Q4 1995 | 11.5% | 15.9% | 34.0% | 34.9% | 3.6% |
| Q1 1996 | 11.5% | 15.9% | 34.2% | 35.0% | 3.5% |
| Q2 1996 | 11.4% | 15.9% | 34.2% | 35.1% | 3.4% |
| Q3 1996 | 11.3% | 15.8% | 34.3% | 35.2% | 3.4% |
| Q4 1996 | 11.4% | 15.8% | 34.5% | 35.0% | 3.4% |
| Q1 1997 | 11.2% | 15.7% | 34.6% | 35.0% | 3.4% |
| Q2 1997 | 11.4% | 15.9% | 34.7% | 34.6% | 3.4% |
| Q3 1997 | 11.4% | 15.9% | 34.8% | 34.4% | 3.4% |
| Q4 1997 | 11.5% | 16.0% | 35.0% | 34.2% | 3.3% |
| Q1 1998 | 11.7% | 16.1% | 35.1% | 33.8% | 3.3% |
| Q2 1998 | 11.7% | 16.1% | 35.2% | 33.8% | 3.2% |
| Q3 1998 | 11.2% | 15.9% | 35.1% | 34.3% | 3.5% |
| Q4 1998 | 11.5% | 16.2% | 35.4% | 33.6% | 3.3% |
| Q1 1999 | 11.2% | 16.2% | 35.5% | 33.7% | 3.4% |
| Q2 1999 | 11.3% | 16.4% | 35.6% | 33.5% | 3.2% |
| Q3 1999 | 11.0% | 16.3% | 35.6% | 33.8% | 3.3% |
| Q4 1999 | 11.3% | 16.6% | 35.9% | 32.9% | 3.2% |
| Q1 2000 | 11.2% | 16.7% | 35.9% | 33.0% | 3.2% |
| Q2 2000 | 10.9% | 16.6% | 35.9% | 33.4% | 3.2% |
| Q3 2000 | 10.7% | 16.6% | 35.8% | 33.6% | 3.3% |
| Q4 2000 | 10.4% | 16.4% | 35.8% | 34.2% | 3.2% |
| Q1 2001 | 9.9% | 16.2% | 35.7% | 35.0% | 3.2% |
| Q2 2001 | 9.9% | 16.3% | 35.8% | 34.9% | 3.1% |
| Q3 2001 | 9.6% | 16.0% | 35.8% | 35.6% | 3.1% |
| Q4 2001 | 9.7% | 16.2% | 35.9% | 35.3% | 3.0% |
| Q1 2002 | 9.6% | 16.2% | 36.0% | 35.3% | 3.0% |
| Q2 2002 | 9.4% | 16.2% | 36.0% | 35.5% | 2.9% |
| Q3 2002 | 9.0% | 16.0% | 36.0% | 36.0% | 3.0% |
| Q4 2002 | 9.0% | 16.1% | 36.0% | 36.0% | 2.9% |
| Q1 2003 | 8.8% | 16.0% | 36.2% | 36.1% | 2.8% |
| Q2 2003 | 9.2% | 16.2% | 36.5% | 35.5% | 2.6% |
| Q3 2003 | 9.2% | 16.3% | 36.5% | 35.3% | 2.6% |
| Q4 2003 | 9.5% | 16.5% | 36.6% | 34.8% | 2.6% |
| Q1 2004 | 9.9% | 16.7% | 36.5% | 34.4% | 2.5% |
| Q2 2004 | 9.9% | 16.7% | 36.5% | 34.3% | 2.6% |
| Q3 2004 | 10.0% | 16.8% | 36.5% | 34.2% | 2.5% |
| Q4 2004 | 10.2% | 16.8% | 36.6% | 33.9% | 2.5% |
| Q1 2005 | 10.2% | 16.7% | 36.7% | 33.9% | 2.5% |
| Q2 2005 | 10.4% | 16.8% | 36.9% | 33.6% | 2.4% |
| Q3 2005 | 10.5% | 16.8% | 36.9% | 33.3% | 2.5% |
| Q4 2005 | 10.5% | 16.7% | 36.9% | 33.3% | 2.5% |
| Q1 2006 | 11.0% | 16.9% | 37.1% | 32.6% | 2.4% |
| Q2 2006 | 11.0% | 16.8% | 37.2% | 32.6% | 2.4% |
| Q3 2006 | 11.1% | 16.9% | 37.3% | 32.4% | 2.4% |
| Q4 2006 | 11.3% | 16.9% | 37.4% | 32.0% | 2.3% |
| Q1 2007 | 11.6% | 17.0% | 37.6% | 31.6% | 2.2% |
| Q2 2007 | 11.7% | 17.0% | 37.8% | 31.3% | 2.1% |
| Q3 2007 | 11.9% | 17.1% | 38.0% | 31.0% | 2.0% |
| Q4 2007 | 11.8% | 17.0% | 38.3% | 31.2% | 1.7% |
| Q1 2008 | 11.6% | 16.9% | 38.5% | 31.5% | 1.5% |
| Q2 2008 | 11.4% | 17.0% | 38.6% | 31.5% | 1.5% |
| Q3 2008 | 11.2% | 17.0% | 38.9% | 31.9% | 1.2% |
| Q4 2008 | 10.6% | 17.1% | 38.8% | 32.5% | 1.0% |
| Q1 2009 | 10.3% | 17.1% | 39.0% | 32.9% | 0.7% |
| Q2 2009 | 10.3% | 17.3% | 39.2% | 32.5% | 0.7% |
| Q3 2009 | 10.6% | 17.5% | 39.4% | 31.9% | 0.7% |
| Q4 2009 | 10.5% | 17.6% | 39.6% | 31.8% | 0.6% |
| Q1 2010 | 10.6% | 17.6% | 39.7% | 31.6% | 0.5% |
| Q2 2010 | 10.5% | 17.6% | 39.9% | 31.5% | 0.5% |
| Q3 2010 | 10.8% | 17.7% | 40.0% | 31.0% | 0.5% |
| Q4 2010 | 11.0% | 17.8% | 40.1% | 30.7% | 0.4% |
| Q1 2011 | 11.3% | 17.9% | 40.0% | 30.5% | 0.4% |
| Q2 2011 | 11.3% | 17.8% | 39.9% | 30.5% | 0.4% |
| Q3 2011 | 11.1% | 17.7% | 39.8% | 31.0% | 0.4% |
| Q4 2011 | 11.3% | 17.7% | 39.8% | 30.8% | 0.4% |
| Q1 2012 | 11.5% | 17.9% | 39.7% | 30.4% | 0.4% |
| Q2 2012 | 11.6% | 17.8% | 39.6% | 30.5% | 0.6% |
| Q3 2012 | 11.8% | 17.8% | 39.5% | 30.3% | 0.6% |
| Q4 2012 | 11.8% | 17.8% | 39.4% | 30.3% | 0.7% |
| Q1 2013 | 12.0% | 17.8% | 39.4% | 30.2% | 0.7% |
| Q2 2013 | 12.0% | 17.6% | 39.4% | 30.2% | 0.8% |
| Q3 2013 | 12.1% | 17.6% | 39.3% | 30.1% | 0.9% |
| Q4 2013 | 12.2% | 17.6% | 39.4% | 30.0% | 0.9% |
| Q1 2014 | 12.3% | 17.7% | 39.4% | 29.7% | 0.9% |
| Q2 2014 | 12.5% | 17.9% | 39.3% | 29.3% | 1.0% |
| Q3 2014 | 12.5% | 17.9% | 39.3% | 29.3% | 1.0% |
| Q4 2014 | 12.6% | 18.0% | 39.4% | 29.1% | 1.0% |
| Q1 2015 | 12.6% | 18.0% | 39.3% | 28.9% | 1.0% |
| Q2 2015 | 12.7% | 18.1% | 39.4% | 28.8% | 1.1% |
| Q3 2015 | 12.5% | 18.0% | 39.4% | 29.0% | 1.1% |
| Q4 2015 | 12.5% | 18.1% | 39.3% | 28.9% | 1.2% |
| Q1 2016 | 12.5% | 18.1% | 39.3% | 28.9% | 1.2% |
| Q2 2016 | 12.6% | 18.2% | 39.4% | 28.7% | 1.2% |
| Q3 2016 | 12.6% | 18.2% | 39.2% | 28.7% | 1.3% |
| Q4 2016 | 12.5% | 18.2% | 39.2% | 28.8% | 1.3% |
| Q1 2017 | 12.5% | 18.2% | 39.3% | 28.7% | 1.3% |
| Q2 2017 | 12.5% | 18.2% | 39.3% | 28.6% | 1.4% |
| Q3 2017 | 12.5% | 18.2% | 39.3% | 28.6% | 1.4% |
| Q4 2017 | 12.5% | 18.3% | 39.3% | 28.4% | 1.4% |
| Q1 2018 | 12.4% | 18.2% | 39.3% | 28.6% | 1.5% |
| Q2 2018 | 12.3% | 18.2% | 39.4% | 28.5% | 1.6% |
| Q3 2018 | 12.4% | 18.3% | 39.5% | 28.4% | 1.5% |
| Q4 2018 | 11.9% | 18.1% | 39.6% | 28.8% | 1.6% |
| Q1 2019 | 12.3% | 18.3% | 39.7% | 28.1% | 1.6% |
| Q2 2019 | 12.3% | 18.3% | 39.7% | 28.2% | 1.6% |
| Q3 2019 | 12.1% | 18.3% | 39.7% | 28.2% | 1.7% |
| Q4 2019 | 12.4% | 18.2% | 39.5% | 28.2% | 1.7% |
| Q1 2020 | 11.7% | 17.5% | 39.3% | 29.6% | 1.8% |
| Q2 2020 | 12.3% | 17.6% | 38.9% | 29.3% | 2.0% |
| Q3 2020 | 12.5% | 17.5% | 38.6% | 29.3% | 2.1% |
| Q4 2020 | 13.0% | 17.6% | 38.3% | 29.0% | 2.2% |
| Q1 2021 | 13.2% | 17.5% | 37.9% | 29.1% | 2.3% |
| Q2 2021 | 13.4% | 17.4% | 37.6% | 29.2% | 2.3% |
| Q3 2021 | 13.5% | 17.3% | 37.4% | 29.4% | 2.4% |
| Q4 2021 | 13.7% | 17.2% | 37.2% | 29.4% | 2.4% |
| Q1 2022 | 13.6% | 16.9% | 36.9% | 30.1% | 2.5% |
| Q2 2022 | 13.1% | 16.3% | 36.5% | 31.3% | 2.7% |
| Q3 2022 | 13.2% | 16.3% | 36.4% | 31.4% | 2.7% |
| Q4 2022 | 13.4% | 16.5% | 36.5% | 31.0% | 2.6% |
| Q1 2023 | 13.5% | 16.6% | 36.5% | 30.8% | 2.6% |
| Q2 2023 | 13.5% | 16.6% | 36.4% | 30.9% | 2.6% |
| Q3 2023 | 13.4% | 16.5% | 36.4% | 31.1% | 2.5% |
| Q4 2023 | 13.6% | 16.7% | 36.5% | 30.7% | 2.5% |
| Q1 2024 | 13.7% | 16.8% | 36.5% | 30.5% | 2.5% |
| Q2 2024 | 13.7% | 16.8% | 36.4% | 30.6% | 2.5% |
| Q3 2024 | 14.0% | 16.9% | 36.5% | 30.2% | 2.4% |
| Q4 2024 | 14.0% | 17.0% | 36.4% | 30.1% | 2.5% |
| Q1 2025 | 13.9% | 16.9% | 36.4% | 30.3% | 2.5% |
| Q2 2025 | 14.1% | 17.1% | 36.4% | 30.1% | 2.5% |
| Q3 2025 | 14.4% | 17.3% | 36.4% | 29.4% | 2.5% |
| Q4 2025 | 14.5% | 17.4% | 36.4% | 29.2% | 2.5% |
Learn More on the Voronoi App 
If you enjoyed today’s post, check out The Global Wealth Pyramid in 2025 on Voronoi.