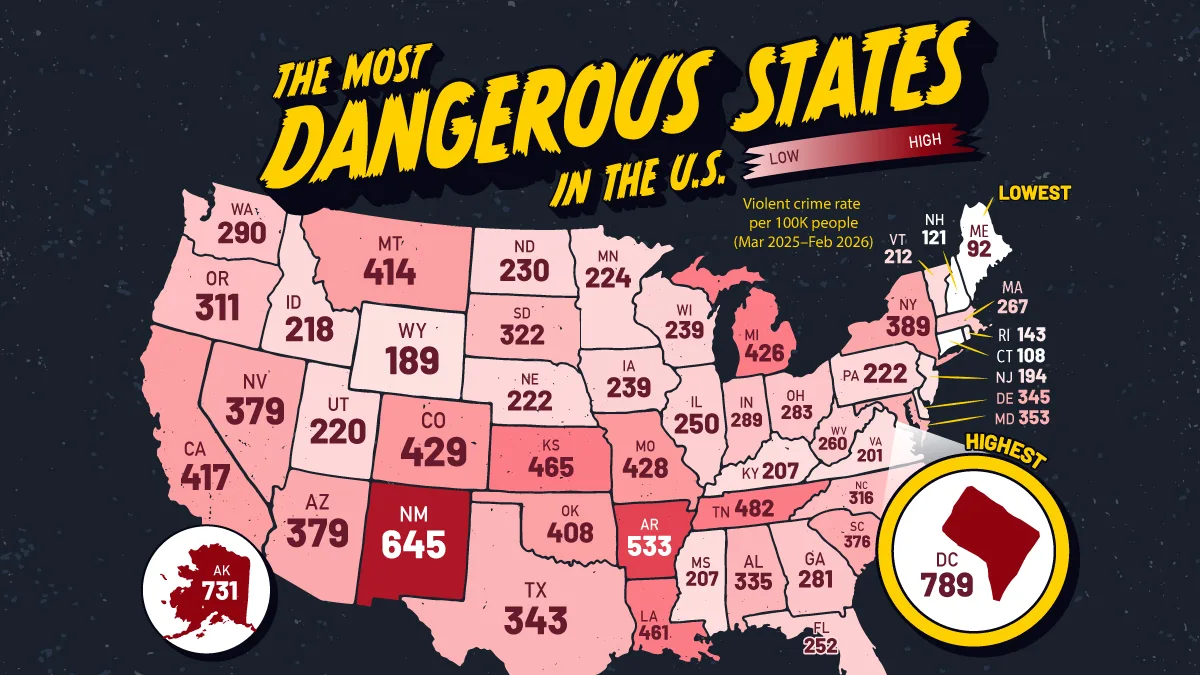
Mapped: The Most Dangerous States in the U.S.
See visuals like this from many other data creators on our Voronoi app. Download it for free on iOS or Android and discover incredible data-driven charts from a variety of trusted sources.
Key Takeaways
- Washington, D.C. recorded the nation’s highest violent crime rate, while Alaska ranked first among the 50 states.
- New Mexico had the highest rate in the contiguous U.S., at 645 violent crimes per 100,000 residents.
- Many Northeastern states, led by Maine, reported the country’s lowest violent crime rates.
Where you live can significantly affect your likelihood of experiencing violent crime, with reported rates varying severalfold across the United States.
This map ranks every U.S. state and the District of Columbia by reported violent crimes per 100,000 residents between March 2025 and February 2026.
The figures include murder, rape, robbery, and aggravated assault, using data from the FBI Crime Data Explorer.
Washington, D.C. and Alaska Top the Rankings
Washington, D.C. recorded the nation’s highest violent crime rate at 789 incidents per 100,000 residents.
D.C.’s rate is partly elevated because it is an entirely urban jurisdiction, unlike states that also include suburban and rural areas.
| Rank | State/District | Violent crime rate per 100K people (Mar 2025–Feb 2026) |
|---|---|---|
| 1 | District of Columbia | 789 |
| 2 | Alaska | 731 |
| 3 | New Mexico | 645 |
| 4 | Arkansas | 533 |
| 5 | Tennessee | 482 |
| 6 | Kansas | 465 |
| 7 | Louisiana | 461 |
| 8 | Colorado | 429 |
| 9 | Missouri | 428 |
| 10 | Michigan | 426 |
| 11 | California | 417 |
| 12 | Montana | 414 |
| 13 | Oklahoma | 408 |
| 14 | New York | 389 |
| 15 | Arizona | 379 |
| 16 | Nevada | 379 |
| 17 | South Carolina | 376 |
| 18 | Maryland | 353 |
| 19 | Delaware | 345 |
| 20 | Texas | 343 |
| 21 | Alabama | 335 |
| 22 | South Dakota | 322 |
| 23 | North Carolina | 316 |
| 24 | Oregon | 311 |
| 25 | Washington | 290 |
| 26 | Indiana | 289 |
| 27 | Ohio | 283 |
| 28 | Georgia | 281 |
| 29 | Massachusetts | 267 |
| 30 | West Virginia | 260 |
| 31 | Florida | 252 |
| 32 | Illinois | 250 |
| 33 | Wisconsin | 239 |
| 34 | Iowa | 239 |
| 35 | North Dakota | 230 |
| 36 | Minnesota | 224 |
| 37 | Pennsylvania | 222 |
| 38 | Nebraska | 222 |
| 39 | Utah | 220 |
| 40 | Idaho | 218 |
| 41 | Vermont | 212 |
| 42 | Mississippi | 207 |
| 43 | Kentucky | 207 |
| 44 | Virginia | 201 |
| 45 | New Jersey | 194 |
| 46 | Hawaii | 190 |
| 47 | Wyoming | 189 |
| 48 | Rhode Island | 143 |
| 49 | New Hampshire | 121 |
| 50 | Connecticut | 108 |
| 51 | Maine | 92 |
Alaska ranked second overall, with 731 violent crimes per 100,000 residents. The state’s elevated rate was largely driven by higher levels of rape and aggravated assault.
Meanwhile, New Mexico recorded 645 violent crimes per 100,000 residents, the highest rate in the contiguous United States.
South and Southwest See Higher Rates
The South and Southwest account for many of the country’s highest violent crime rates. Alongside New Mexico, Arkansas, Tennessee, Louisiana, Oklahoma, and Texas all ranked in the upper half of the list, though the underlying factors vary widely by state.
For example, New Orleans has more murders per capita than any other city in the country, contributing to Louisiana’s rate of 461 violent crimes per 100,000 people, the seventh highest in the country.
More broadly, violent crime is shaped by a range of factors, including poverty, policing strategies, substance abuse, and population density.
Northeastern States Report the Lowest Crime Rates
The Northeast dominates the bottom of the ranking. Maine reported the nation’s lowest violent crime rate at just 92 incidents per 100,000 residents, followed by Connecticut, New Hampshire, and Rhode Island.
Several other Northeastern states, including New Jersey and Massachusetts, also posted relatively low rates.
Although crime rates differ substantially across states, violent crime in the U.S. has generally declined over the past several decades. This makes today’s geographic differences more notable than the long-term national trend.
Learn More on the Voronoi App 
If you enjoyed today’s post, check out Mapped: U.S. Financial Crimes by State on Voronoi.