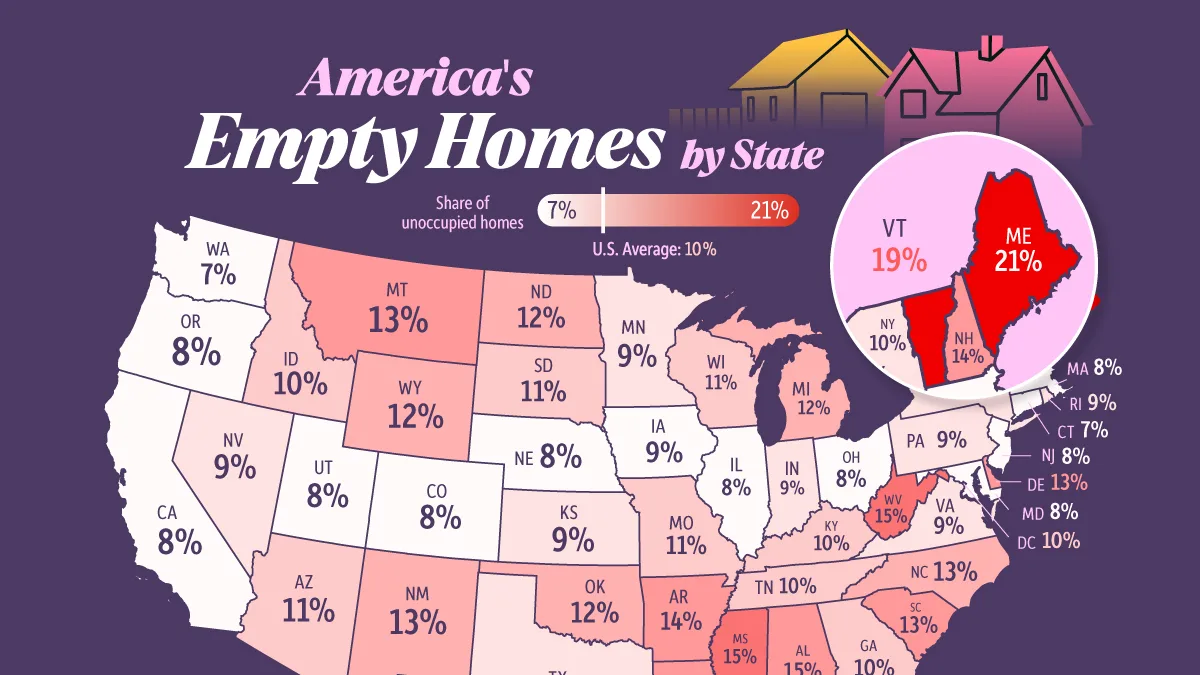
Mapped: The States With the Most Empty Homes
Key Takeaways
- Maine has the highest home vacancy rate in America, with roughly one in five housing units unoccupied.
- Vacation destinations rank prominently because seasonal and recreational properties count as vacant in Census data.
- A low vacancy rate can signal strong housing demand rather than greater affordability.
America faces a housing shortage, yet about 14.5 million homes across the country are vacant. How can both be true?
Using the latest U.S. Census Bureau data compiled by LendingTree, this map shows the share of vacant housing units in every state. The figures include vacation homes, rentals awaiting tenants, homes for sale, and other unoccupied properties, not just abandoned buildings.
Which States Have the Highest Vacancy Rates?
About one in 10 U.S. housing units is vacant, but most are not permanently sitting unused.
Nearly 4.7 million vacant units are seasonal or recreational homes, 2.6 million are available for rent, and fewer than 800,000 are actively listed for sale. This helps explain why states with large vacation-home markets, including Maine, Vermont, Florida, and Hawaii, record some of the nation’s highest vacancy rates.
| Rank | State | Vacancy Rate 2024 | Vacant Housing Units |
|---|---|---|---|
| 1 | Maine | 20.6% | 154,717 |
| 2 | Vermont | 19.4% | 65,626 |
| 3 | Alaska | 17.6% | 57,958 |
| 4 | West Virginia | 15.4% | 132,670 |
| 5 | Florida | 14.7% | 1,503,660 |
| 6 | Mississippi | 14.6% | 195,683 |
| 7 | Alabama | 14.5% | 340,018 |
| 8 | Louisiana | 14.4% | 304,122 |
| 9 | New Hampshire | 14.3% | 92,650 |
| 10 | Arkansas | 13.5% | 188,686 |
| 11 | Delaware | 13.4% | 62,165 |
| 12 | Hawaii | 13.3% | 75,443 |
| 13 | South Carolina | 13.3% | 325,050 |
| 14 | Montana | 13.2% | 69,560 |
| 15 | New Mexico | 12.5% | 119,550 |
| 16 | North Carolina | 12.5% | 613,323 |
| 17 | North Dakota | 12.3% | 46,218 |
| 18 | Wyoming | 12.2% | 33,823 |
| 19 | Oklahoma | 12.0% | 212,738 |
| 20 | Michigan | 11.8% | 545,867 |
| 21 | Missouri | 11.2% | 317,060 |
| 22 | Wisconsin | 10.8% | 299,092 |
| 23 | Arizona | 10.5% | 336,758 |
| 24 | South Dakota | 10.5% | 43,040 |
| 25 | Georgia | 10.3% | 467,469 |
| 26 | Idaho | 10.3% | 82,009 |
| 27 | Kentucky | 10.3% | 208,647 |
| 28 | Tennessee | 10.2% | 319,393 |
| 29 | District of Columbia | 10.1% | 36,523 |
| 30 | New York | 10.0% | 862,595 |
| 31 | Texas | 9.4% | 1,135,699 |
| 32 | Minnesota | 9.3% | 237,075 |
| 33 | Nevada | 9.3% | 123,878 |
| 34 | Kansas | 9.2% | 119,575 |
| 35 | Pennsylvania | 9.2% | 531,599 |
| 36 | Rhode Island | 9.1% | 44,362 |
| 37 | Indiana | 8.8% | 260,559 |
| 38 | Virginia | 8.7% | 319,024 |
| 39 | Iowa | 8.5% | 121,992 |
| 40 | Colorado | 8.3% | 214,835 |
| 41 | Massachusetts | 8.1% | 245,364 |
| 42 | Ohio | 8.1% | 429,200 |
| 43 | Utah | 8.1% | 98,646 |
| 44 | Illinois | 7.7% | 421,003 |
| 45 | Maryland | 7.7% | 197,856 |
| 46 | Nebraska | 7.6% | 65,597 |
| 47 | California | 7.5% | 1,096,644 |
| 48 | New Jersey | 7.5% | 283,653 |
| 49 | Oregon | 7.5% | 139,570 |
| 50 | Washington | 7.3% | 241,800 |
| 51 | Connecticut | 7.0% | 107,815 |
| — |  U.S. total U.S. total |
10.1% | 14,547,859 |
Maine leads the country with a vacancy rate of 20.6%, followed by Vermont at 19.4% and Alaska at 17.6%. At the other end of the ranking, Washington and Connecticut have rates of around 7%, while California, New Jersey, and Massachusetts also sit near the bottom.
In these states, available housing is often absorbed quickly, leaving fewer homes unoccupied. A low vacancy rate can therefore reflect strong demand, not necessarily a healthier or more affordable housing market.
Why Empty Homes Won’t Solve the Housing Crisis
At first glance, millions of vacant homes may appear sufficient to ease America’s housing shortage. In practice, many are not available to year-round buyers or renters.
Some are second homes or seasonal properties concentrated in vacation destinations, while others are temporarily vacant between tenants or owners. High vacancy rates and housing shortages can therefore exist at the same time, particularly in expensive metropolitan areas where year-round housing remains scarce.
Learn More on the Voronoi App 
To learn more about this topic, check out this graphic on the salary needed to afford rent across America.