Mapped: Where Cars Eat Up the Biggest Share of Income
Key Takeaways
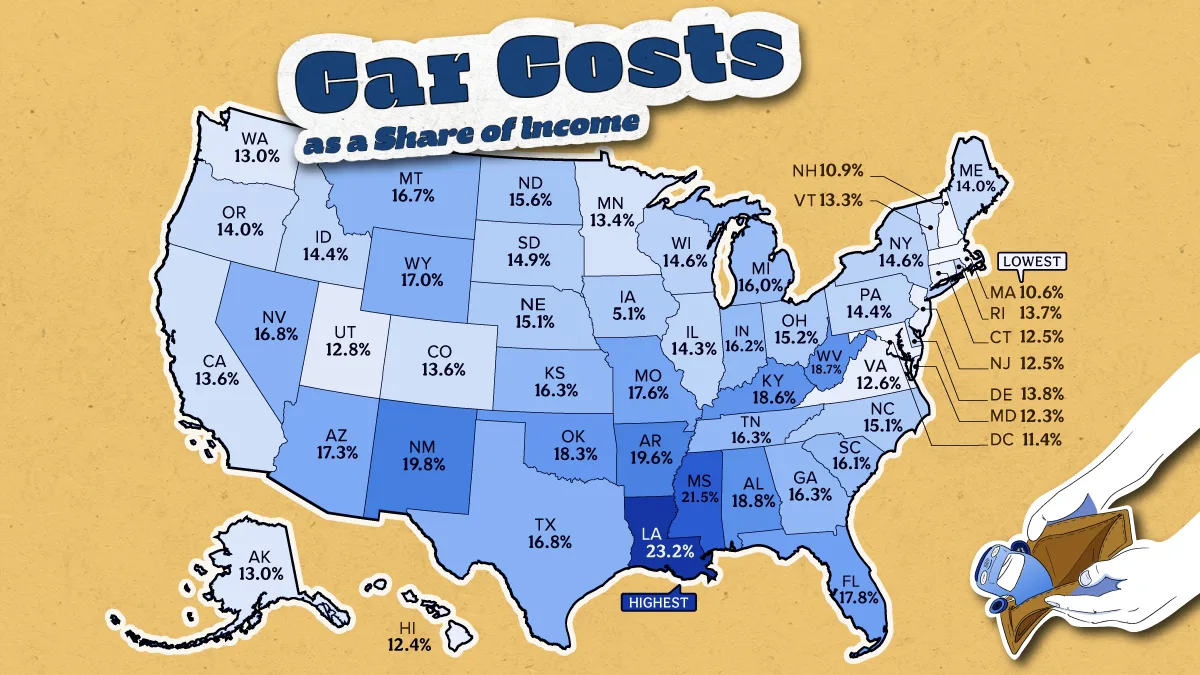
- Louisiana has the highest car ownership burden in the U.S., with annual costs consuming 23.2% of median household income.
- The typical U.S. household spends 15% of its income on car payments, insurance, fuel, and maintenance.
- Eight of the 10 least affordable states for car ownership are in the South.
For many Americans, owning a car is a necessity, but the financial burden varies dramatically by state. In the least affordable places, annual vehicle expenses consume nearly one-quarter of the typical household’s income.
This map ranks every state by annual car ownership costs as a share of median household income, based on analysis from LendingTree of active auto loan holders. The estimates include financing, insurance, fuel, and maintenance.
The States Where Car Ownership Costs the Most
The table below ranks every state by annual car ownership costs as a share of median household income.
| State | Total Costs | Median Household Income | % of Household Income |
|---|---|---|---|
| Louisiana | $14,894 | $64,199 | 23.2% |
| Mississippi | $13,378 | $62,242 | 21.5% |
| New Mexico | $14,115 | $71,388 | 19.8% |
| Arkansas | $12,798 | $65,378 | 19.6% |
| Alabama | $13,164 | $70,171 | 18.8% |
| West Virginia | $11,951 | $64,001 | 18.7% |
| Kentucky | $12,628 | $67,925 | 18.6% |
| Oklahoma | $12,722 | $69,633 | 18.3% |
| Florida | $14,546 | $81,830 | 17.8% |
| Missouri | $13,235 | $75,360 | 17.6% |
| Arizona | $14,860 | $85,779 | 17.3% |
| Wyoming | $13,533 | $79,511 | 17.0% |
| Texas | $14,139 | $83,921 | 16.8% |
| Nevada | $14,341 | $85,408 | 16.8% |
| Montana | $13,245 | $79,309 | 16.7% |
| Georgia | $13,733 | $84,205 | 16.3% |
| Tennessee | $12,350 | $75,790 | 16.3% |
| Kansas | $12,941 | $79,492 | 16.3% |
| Indiana | $12,269 | $75,750 | 16.2% |
| South Carolina | $12,233 | $76,161 | 16.1% |
| Michigan | $12,208 | $76,202 | 16.0% |
| North Dakota | $12,766 | $81,973 | 15.6% |
| Ohio | $11,574 | $76,016 | 15.2% |
| Iowa | $11,992 | $79,478 | 15.1% |
| North Carolina | $11,725 | $77,854 | 15.1% |
| Nebraska | $12,133 | $80,399 | 15.1% |
| South Dakota | $12,092 | $80,931 | 14.9% |
| Wisconsin | $11,947 | $81,570 | 14.6% |
| New York | $13,183 | $90,341 | 14.6% |
| Idaho | $12,340 | $85,442 | 14.4% |
| Pennsylvania | $11,735 | $81,630 | 14.4% |
| Illinois | $12,549 | $87,594 | 14.3% |
| Maine | $11,231 | $80,469 | 14.0% |
| Oregon | $12,528 | $89,709 | 14.0% |
| Delaware | $12,680 | $92,145 | 13.8% |
| Rhode Island | $12,042 | $87,903 | 13.7% |
| Colorado | $13,876 | $102,229 | 13.6% |
| California | $14,325 | $105,425 | 13.6% |
| Minnesota | $12,304 | $91,706 | 13.4% |
| Vermont | $11,542 | $87,088 | 13.3% |
| Alaska | $13,051 | $100,705 | 13.0% |
| Washington | $13,558 | $104,625 | 13.0% |
| Utah | $13,023 | $101,750 | 12.8% |
| Virginia | $12,214 | $96,941 | 12.6% |
| New Jersey | $13,708 | $109,788 | 12.5% |
| Connecticut | $12,630 | $101,109 | 12.5% |
| Hawaii | $13,193 | $106,052 | 12.4% |
| Maryland | $13,314 | $108,326 | 12.3% |
| District of Columbia | $13,205 | $115,486 | 11.4% |
| New Hampshire | $11,418 | $105,038 | 10.9% |
| Massachusetts | $11,745 | $110,350 | 10.6% |
 U.S. Average U.S. Average |
$12,841 | $85,759 | 15.0% |
Data is for active auto loan holders. Cost and income figures were adjusted to 2026 dollars.
Louisiana is the nation’s least affordable state for car ownership, with the typical household spending 23.2% of its income, or $14,894 annually, on vehicle expenses. By comparison, Massachusetts households devote just 10.6% of their income to car ownership.
Mississippi, New Mexico, Arkansas, and Alabama round out the top five, with households in each spending roughly one-fifth of their income on car ownership.
Why Car Ownership Is Less Affordable Across the South
The South dominates the least affordable rankings because many states combine relatively modest household incomes with high ownership costs.
Insurance is one major factor. Louisiana and Florida, for example, consistently rank among the country’s most expensive states for auto insurance due to severe weather, litigation costs, and high accident claims.
Drivers in many Southern states also travel more miles each year, increasing spending on fuel, maintenance, and repairs.
America’s Most Affordable States for Car Ownership
Massachusetts has the nation’s lowest car ownership burden, with annual costs equal to 10.6% of median household income, or $11,745.
New Hampshire and Maryland also rank among the most affordable states, helping make the Northeast the country’s least financially burdensome region for car ownership. Higher incomes help keep costs manageable across much of the region, while extensive public transit may allow some households to drive less or own fewer vehicles.
These rankings show that car affordability depends on more than the cost of owning and operating a vehicle. Household income also plays a major role, meaning similar expenses can create very different financial burdens depending on where people live.
Learn More on the Voronoi App 
To learn more about this topic, check out this graphic on the cheapest car brands to own and maintain.