America’s Renewable Energy Boom, in One Chart
Key Takeaways
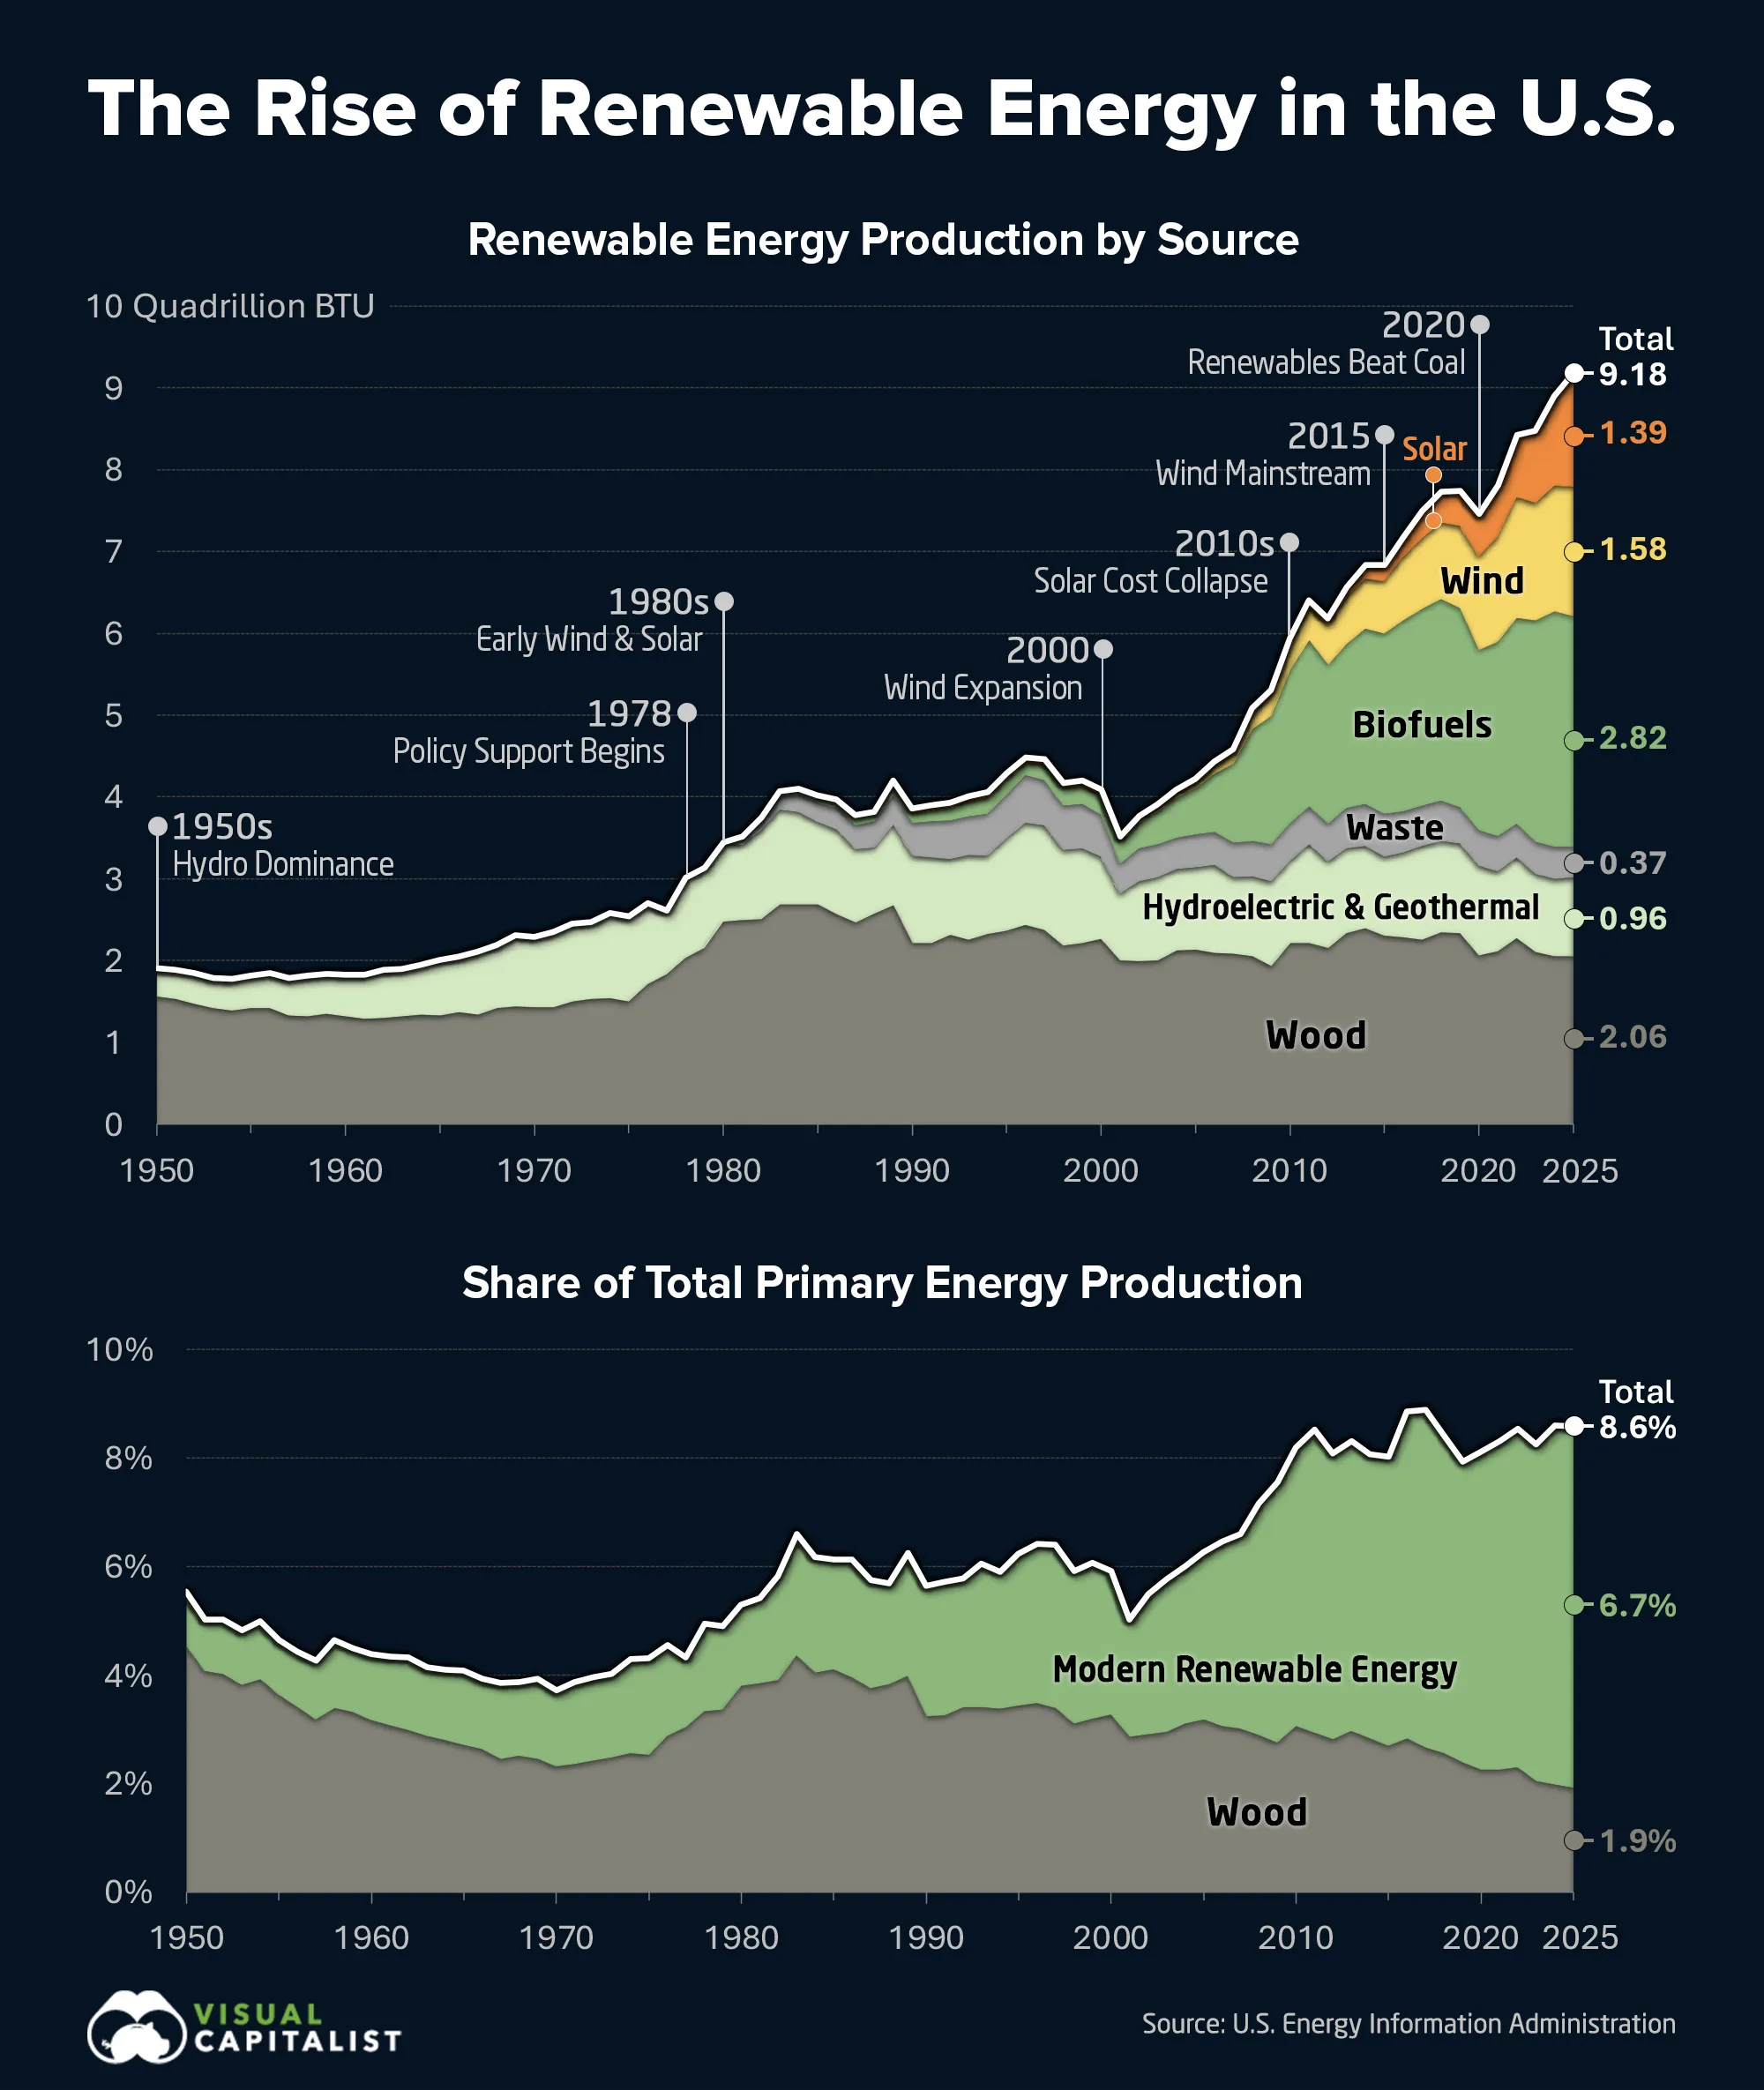
- U.S. renewable energy production reached a record 9.18 quadrillion Btu (quads) in 2025, nearly five times its 1950 level.
- Wind, solar, and biofuels have expanded by more than 1,700% since 2000 and now account for 63% of U.S. renewable energy production.
- Even after decades of growth, renewables still supply just 8.6% of total U.S. primary energy production.
America’s renewable energy story began long before modern wind turbines and solar panels. In 1950, wood supplied more than four-fifths of the country’s renewable energy, while hydroelectric and geothermal sources accounted for nearly all the remainder.
Since then, the mix has been transformed by the growth of biofuels, wind, and solar.
Data for this visualization comes from the U.S. Energy Information Administration and tracks annual production from 1950 through 2025 across wood, hydroelectric and geothermal energy, waste, biofuels, wind, and solar. The figures measure primary energy production, not electricity generation or installed capacity.
Renewable Energy Output Rose Nearly Fivefold Since 1950
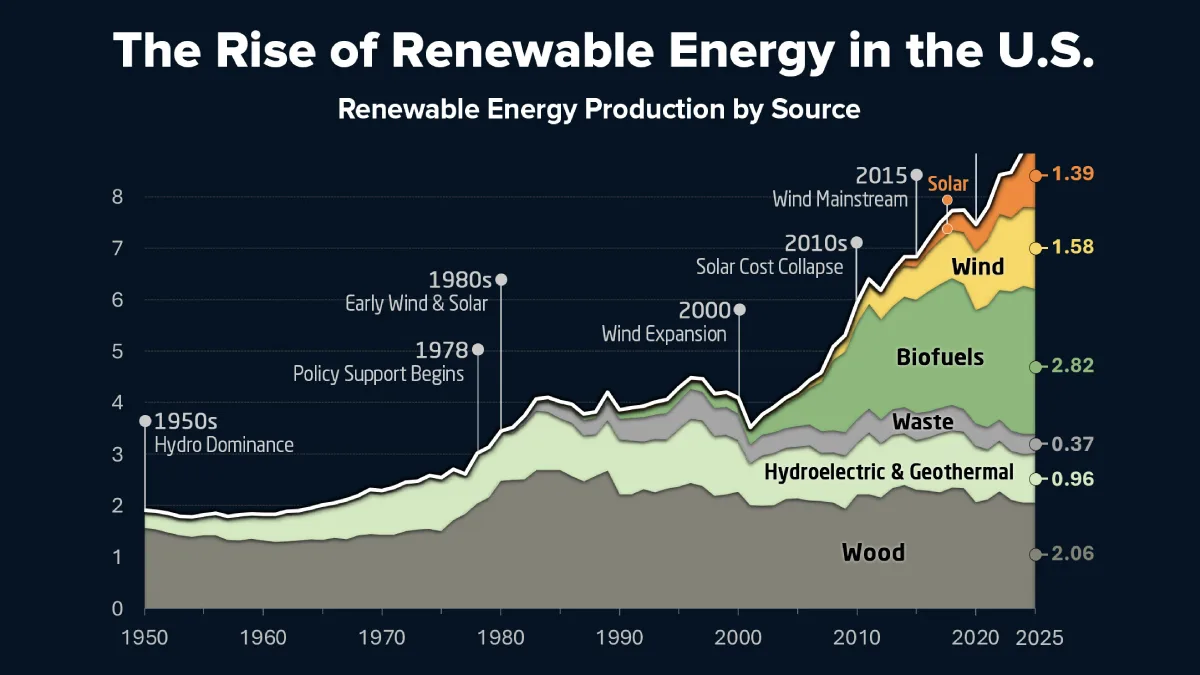
U.S. renewable energy production grew by 381% between 1950 and 2025, rising from 1.91 to 9.18 quads. The increase was not linear: output stayed near 2 quads through the 1950s and 1960s, then climbed above 4 quads by the early 1980s as the oil crises of the 1970s helped drive greater use of wood, waste, and biofuels.
The table below shows U.S. renewable energy production by source at 15-year intervals, measured in quadrillion Btu (quads):
| Energy Source | U.S. Renewable Energy Production by Year (Quadrillion Btu) | |||||
|---|---|---|---|---|---|---|
| 1950 | 1965 | 1980 | 1995 | 2010 | 2025 | |
| Wood | 1.562 | 1.335 | 2.474 | 2.37 | 2.217 | 2.058 |
| Hydroelectric and Geothermal | 0.344 | 0.673 | 0.97 | 1.12 | 0.999 | 0.96 |
| Waste | 0 | 0 | 0.002 | 0.531 | 0.468 | 0.372 |
| Biofuels | 0 | 0 | 0 | 0.198 | 1.868 | 2.817 |
| Wind | 0 | 0 | 0 | 0.011 | 0.323 | 1.585 |
| Solar | 0 | 0 | 0 | 0.064 | 0.068 | 1.388 |
| Total | 1.907 | 2.008 | 3.445 | 4.295 | 5.943 | 9.182 |
Growth accelerated again after 2000, with total output more than doubling from 4.09 quads to a record 9.18 quads in 2025.
The two major growth periods had different drivers. The first followed the oil shocks of the 1970s and relied largely on biomass. The second was powered by federal biofuel mandates and the falling costs of wind and solar.
Production dipped from 7.75 quads in 2019 to 7.45 quads in 2020, then reached new highs in every year from 2021 through 2025.
Renewables Supplied 8.6% of U.S. Energy Production in 2025
In 2025, wood accounted for 1.9% of U.S. primary energy production, while modern renewables supplied 6.7%. Together, they represented 8.6% of the total.
The table below shows the shares of wood and modern renewables in total U.S. primary energy production at 15-year intervals from 1950 to 2025:
| Energy Source | Share of U.S. Primary Energy Production by Year (%) | |||||
|---|---|---|---|---|---|---|
| 1950 | 1965 | 1980 | 1995 | 2010 | 2025 | |
| Wood | 4.5 | 2.7 | 3.8 | 3.4 | 3.1 | 1.9 |
| Modern Renewables | 1.0 | 1.4 | 1.5 | 2.8 | 5.1 | 6.7 |
| All Renewables | 5.5 | 4.1 | 5.3 | 6.2 | 8.2 | 8.6 |
Wood’s share has fallen to less than half its 1950 level, while the share from modern renewables has climbed from 1.0% to 6.7%. However, the combined renewable share peaked at 8.9% in 2016. Renewable production has continued to grow, but rising oil and gas output has expanded total U.S. energy production even faster.
Despite this progress, growth in clean energy’s share of U.S. electricity generation has lagged behind that of several other major economies over the past decade.
Wind, Solar, and Biofuels Reshaped the Energy Mix
Wind and solar supplied just 0.08 quads combined in 2000. By 2025, their combined output had reached 2.97 quads, more than 38 times the 2000 level and nearly one-third of U.S. renewable energy production.
Biofuels overtook wood as the largest single renewable source in 2016 and have led the mix ever since. In 2025, biofuels produced 2.82 quads, or 31% of the renewable total. Wood remained the second-largest source at 2.06 quads, and together the two biomass-based sources supplied 53% of U.S. renewable energy.
Hydroelectric and geothermal energy produced 0.96 quads in 2025, compared with 0.37 quads from waste. These sources have been comparatively stable in recent decades, meaning most of the change in the renewable mix has come from biofuels, wind, and solar.
The table below shows each source’s share of U.S. renewable energy production at the same 15-year intervals:
| Energy Source | Share of U.S. Renewable Energy Production by Year (%) | |||||
|---|---|---|---|---|---|---|
| 1950 | 1965 | 1980 | 1995 | 2010 | 2025 | |
| Wood | 81.9 | 66.5 | 71.8 | 55.2 | 37.3 | 22.4 |
| Hydroelectric and Geothermal | 18.0 | 33.5 | 28.2 | 26.1 | 16.8 | 10.5 |
| Waste | 0.0 | 0.0 | 0.1 | 12.4 | 7.9 | 4.1 |
| Biofuels | 0.0 | 0.0 | 0.0 | 4.6 | 31.4 | 30.7 |
| Wind | 0.0 | 0.0 | 0.0 | 0.3 | 5.4 | 17.3 |
| Solar | 0.0 | 0.0 | 0.0 | 1.5 | 1.1 | 15.1 |
| Total | 100.0 | 100.0 | 100.0 | 100.0 | 100.0 | 100.0 |
Viewed as percentage shares, the reshuffling is stark. Wood fell from 81.9% of renewable production in 1950 to 22.4% in 2025. Hydroelectric and geothermal energy’s combined share declined from 18.0% to 10.5%, even as their absolute output nearly tripled.
The full dataset below shows U.S. renewable energy production by source for every year from 1950 to 2025:
| Year | U.S. Renewable Energy Production by Source (Quadrillion Btu) | ||||||
|---|---|---|---|---|---|---|---|
| Wood | Hydroelectric and Geothermal | Waste | Biofuels | Wind | Solar | Total | |
| 1950 | 1.562 | 0.344 | 0 | 0 | 0 | 0 | 1.907 |
| 1951 | 1.535 | 0.356 | 0 | 0 | 0 | 0 | 1.891 |
| 1952 | 1.474 | 0.374 | 0 | 0 | 0 | 0 | 1.849 |
| 1953 | 1.419 | 0.374 | 0 | 0 | 0 | 0 | 1.793 |
| 1954 | 1.394 | 0.381 | 0 | 0 | 0 | 0 | 1.775 |
| 1955 | 1.424 | 0.397 | 0 | 0 | 0 | 0 | 1.821 |
| 1956 | 1.416 | 0.427 | 0 | 0 | 0 | 0 | 1.843 |
| 1957 | 1.334 | 0.455 | 0 | 0 | 0 | 0 | 1.789 |
| 1958 | 1.323 | 0.49 | 0 | 0 | 0 | 0 | 1.813 |
| 1959 | 1.353 | 0.482 | 0 | 0 | 0 | 0 | 1.834 |
| 1960 | 1.32 | 0.51 | 0 | 0 | 0 | 0 | 1.83 |
| 1961 | 1.295 | 0.531 | 0 | 0 | 0 | 0 | 1.826 |
| 1962 | 1.3 | 0.587 | 0 | 0 | 0 | 0 | 1.888 |
| 1963 | 1.323 | 0.577 | 0 | 0 | 0 | 0 | 1.9 |
| 1964 | 1.337 | 0.616 | 0 | 0 | 0 | 0 | 1.953 |
| 1965 | 1.335 | 0.673 | 0 | 0 | 0 | 0 | 2.008 |
| 1966 | 1.369 | 0.676 | 0 | 0 | 0 | 0 | 2.045 |
| 1967 | 1.34 | 0.769 | 0 | 0 | 0 | 0 | 2.109 |
| 1968 | 1.419 | 0.772 | 0 | 0 | 0 | 0 | 2.192 |
| 1969 | 1.44 | 0.867 | 0 | 0 | 0 | 0 | 2.307 |
| 1970 | 1.429 | 0.858 | 0.002 | 0 | 0 | 0 | 2.289 |
| 1971 | 1.43 | 0.922 | 0.002 | 0 | 0 | 0 | 2.354 |
| 1972 | 1.501 | 0.946 | 0.002 | 0 | 0 | 0 | 2.449 |
| 1973 | 1.527 | 0.946 | 0.002 | 0 | 0 | 0 | 2.476 |
| 1974 | 1.538 | 1.046 | 0.002 | 0 | 0 | 0 | 2.586 |
| 1975 | 1.497 | 1.045 | 0.002 | 0 | 0 | 0 | 2.544 |
| 1976 | 1.711 | 0.991 | 0.002 | 0 | 0 | 0 | 2.705 |
| 1977 | 1.837 | 0.775 | 0.002 | 0 | 0 | 0 | 2.613 |
| 1978 | 2.036 | 0.977 | 0.001 | 0 | 0 | 0 | 3.015 |
| 1979 | 2.15 | 0.979 | 0.002 | 0 | 0 | 0 | 3.131 |
| 1980 | 2.474 | 0.97 | 0.002 | 0 | 0 | 0 | 3.445 |
| 1981 | 2.496 | 0.92 | 0.088 | 0.013 | 0 | 0 | 3.516 |
| 1982 | 2.51 | 1.082 | 0.119 | 0.034 | 0 | 0 | 3.746 |
| 1983 | 2.684 | 1.165 | 0.157 | 0.063 | 0 | 0 | 4.069 |
| 1984 | 2.686 | 1.133 | 0.208 | 0.077 | 0 | 0 | 4.104 |
| 1985 | 2.687 | 1.002 | 0.236 | 0.093 | 0 | 0 | 4.018 |
| 1986 | 2.562 | 1.038 | 0.263 | 0.107 | 0 | 0 | 3.97 |
| 1987 | 2.463 | 0.9 | 0.289 | 0.123 | 0 | 0 | 3.774 |
| 1988 | 2.577 | 0.807 | 0.315 | 0.124 | 0 | 0 | 3.823 |
| 1989 | 2.68 | 0.987 | 0.354 | 0.125 | 0.007 | 0.052 | 4.206 |
| 1990 | 2.216 | 1.062 | 0.408 | 0.111 | 0.01 | 0.056 | 3.863 |
| 1991 | 2.214 | 1.052 | 0.44 | 0.128 | 0.01 | 0.058 | 3.901 |
| 1992 | 2.313 | 0.93 | 0.473 | 0.145 | 0.01 | 0.06 | 3.932 |
| 1993 | 2.26 | 1.027 | 0.479 | 0.169 | 0.01 | 0.062 | 4.007 |
| 1994 | 2.324 | 0.954 | 0.515 | 0.188 | 0.012 | 0.063 | 4.056 |
| 1995 | 2.37 | 1.12 | 0.531 | 0.198 | 0.011 | 0.064 | 4.295 |
| 1996 | 2.437 | 1.249 | 0.577 | 0.141 | 0.011 | 0.065 | 4.48 |
| 1997 | 2.371 | 1.283 | 0.551 | 0.186 | 0.011 | 0.064 | 4.466 |
| 1998 | 2.184 | 1.171 | 0.542 | 0.202 | 0.01 | 0.063 | 4.174 |
| 1999 | 2.214 | 1.16 | 0.54 | 0.211 | 0.015 | 0.062 | 4.203 |
| 2000 | 2.262 | 1.009 | 0.511 | 0.233 | 0.019 | 0.059 | 4.093 |
| 2001 | 2.006 | 0.81 | 0.364 | 0.254 | 0.023 | 0.057 | 3.514 |
| 2002 | 1.995 | 0.975 | 0.402 | 0.308 | 0.035 | 0.055 | 3.771 |
| 2003 | 2.002 | 1.018 | 0.401 | 0.401 | 0.038 | 0.054 | 3.914 |
| 2004 | 2.121 | 0.996 | 0.389 | 0.486 | 0.048 | 0.053 | 4.093 |
| 2005 | 2.137 | 1.006 | 0.403 | 0.561 | 0.061 | 0.052 | 4.22 |
| 2006 | 2.099 | 1.073 | 0.397 | 0.716 | 0.091 | 0.054 | 4.43 |
| 2007 | 2.089 | 0.936 | 0.413 | 0.97 | 0.118 | 0.057 | 4.582 |
| 2008 | 2.059 | 0.966 | 0.435 | 1.374 | 0.189 | 0.061 | 5.085 |
| 2009 | 1.935 | 1.038 | 0.452 | 1.57 | 0.252 | 0.063 | 5.309 |
| 2010 | 2.217 | 0.999 | 0.468 | 1.868 | 0.323 | 0.068 | 5.943 |
| 2011 | 2.213 | 1.205 | 0.462 | 2.037 | 0.41 | 0.076 | 6.404 |
| 2012 | 2.151 | 1.059 | 0.467 | 1.936 | 0.48 | 0.094 | 6.187 |
| 2013 | 2.338 | 1.034 | 0.496 | 2 | 0.573 | 0.12 | 6.561 |
| 2014 | 2.398 | 1.003 | 0.516 | 2.135 | 0.62 | 0.161 | 6.833 |
| 2015 | 2.305 | 0.968 | 0.518 | 2.201 | 0.651 | 0.196 | 6.84 |
| 2016 | 2.29 | 1.031 | 0.503 | 2.329 | 0.774 | 0.251 | 7.179 |
| 2017 | 2.254 | 1.143 | 0.495 | 2.407 | 0.868 | 0.329 | 7.495 |
| 2018 | 2.348 | 1.116 | 0.487 | 2.471 | 0.93 | 0.384 | 7.736 |
| 2019 | 2.333 | 1.099 | 0.442 | 2.432 | 1.01 | 0.43 | 7.745 |
| 2020 | 2.066 | 1.091 | 0.44 | 2.194 | 1.153 | 0.511 | 7.454 |
| 2021 | 2.112 | 0.976 | 0.43 | 2.374 | 1.29 | 0.625 | 7.808 |
| 2022 | 2.274 | 0.988 | 0.412 | 2.511 | 1.482 | 0.764 | 8.43 |
| 2023 | 2.104 | 0.955 | 0.394 | 2.705 | 1.437 | 0.878 | 8.472 |
| 2024 | 2.057 | 0.945 | 0.387 | 2.875 | 1.542 | 1.1 | 8.895 |
| 2025 | 2.058 | 0.96 | 0.372 | 2.817 | 1.585 | 1.388 | 9.182 |
This shift matters beyond the renewable mix itself. Electrification and AI data center construction are pushing U.S. electricity demand into its strongest period of growth in two decades, increasing the urgency around how quickly wind and solar can continue to scale.
Learn More on the Voronoi App 
If you enjoyed today’s post, check out One Decade of Renewable Energy Progress in America on Voronoi.