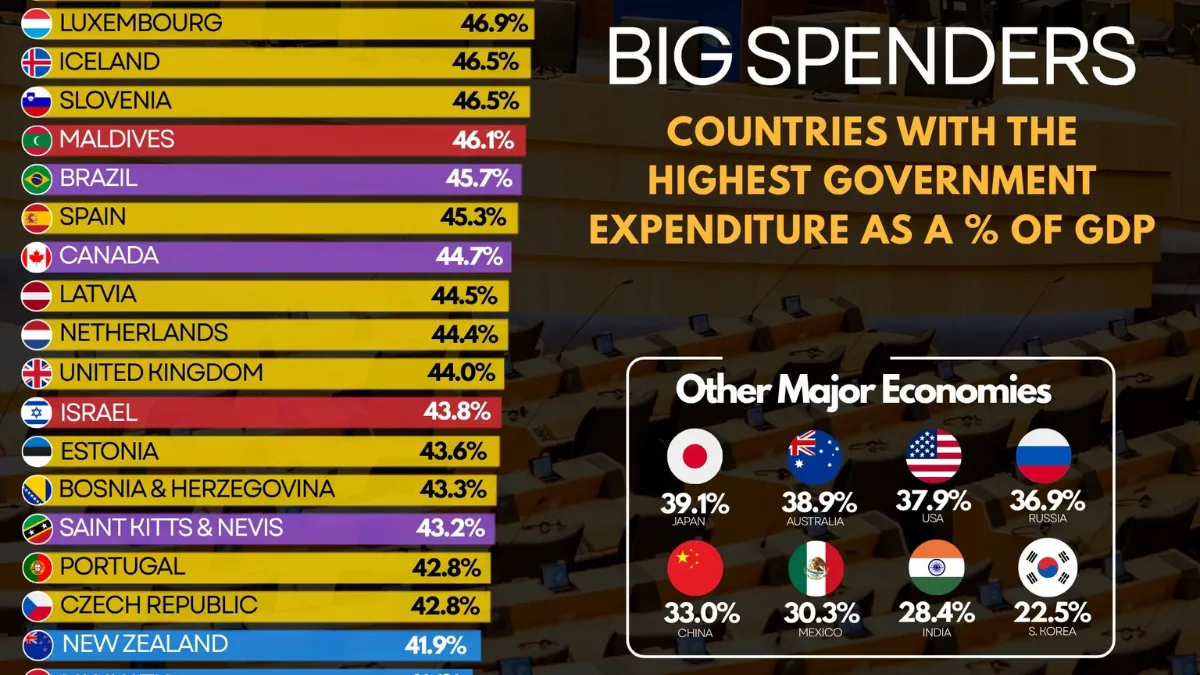
Ranked: Countries With the Biggest Governments
This was originally posted on our Voronoi app. Download the app for free on iOS or Android and discover incredible data-driven charts from a variety of trusted sources.
Key Takeaways:
- Kiribati ranks first by a wide margin, with government expenditure equal to 98.1% of GDP—more than 26 percentage points above the second-place Marshall Islands (71.6%).
- Many of the world’s highest-spending governments are either small island economies or European welfare states, reflecting two very different drivers of public expenditure.
- Among major economies, France spends the most relative to GDP at 57.2%, while South Korea (22.5%), India (28.4%), and Mexico (30.3%) rank far lower.
Government spending plays a central role in every economy, funding everything from healthcare and pensions to infrastructure, education, and defense. However, the share of economic output devoted to public expenditure varies widely across countries, reflecting differences in demographics and fiscal priorities.
This visualization, created by Iswardi Ishak, uses data from the International Monetary Fund (IMF) to compare general government expenditure as a percentage of GDP across countries.
Which Countries Spend the Most?
Below are the countries with the highest government expenditure as a share of GDP, based on IMF data.
| Rank | Country | Government Expenditure (% of GDP) |
|---|---|---|
| 1 |  Kiribati Kiribati |
98.08 |
| 2 |  Marshall Islands Marshall Islands |
71.58 |
| 3 |  Ukraine Ukraine |
71.27 |
| 4 |  Dominica Dominica |
58.8 |
| 5 |  Finland Finland |
57.68 |
| 6 |  France France |
57.17 |
| 7 |  Micronesia Micronesia |
56.97 |
| 8 |  Austria Austria |
56.03 |
| 9 |  Belgium Belgium |
54.49 |
| 10 |  Lesotho Lesotho |
53.48 |
| 11 |  Italy Italy |
50.56 |
| 12 |  Kuwait Kuwait |
50.41 |
| 13 |  Germany Germany |
49.43 |
| 14 |  Poland Poland |
49.41 |
| 15 |  Sweden Sweden |
49.30 |
| 16 |  Norway Norway |
48.48 |
| 17 |  Croatia Croatia |
48.00 |
| 18 |  Greece Greece |
47.98 |
| 19 |  Denmark Denmark |
47.33 |
| 20 |  Slovak Republic Slovak Republic |
47.12 |
| 21 |  Hungary Hungary |
46.87 |
| 22 |  Luxembourg Luxembourg |
46.87 |
| 23 |  Iceland Iceland |
46.54 |
| 24 |  Slovenia Slovenia |
46.47 |
| 25 |  Maldives Maldives |
46.08 |
| 26 |  Brazil Brazil |
45.68 |
| 27 |  Spain Spain |
45.34 |
| 28 |  Canada Canada |
44.72 |
| 29 |  Latvia Latvia |
44.47 |
| 30 |  Netherlands Netherlands |
44.41 |
| 31 |  United Kingdom United Kingdom |
44.04 |
| 32 |  Israel Israel |
43.79 |
| 33 |  Estonia Estonia |
43.62 |
| 34 |  Bosnia and Herzegovina Bosnia and Herzegovina |
43.32 |
| 35 |  Saint Kitts and Nevis Saint Kitts and Nevis |
43.17 |
| 36 |  Portugal Portugal |
42.77 |
| 37 |  Czech Republic Czech Republic |
42.75 |
| 38 |  New Zealand New Zealand |
41.86 |
| 39 |  Vanuatu Vanuatu |
41.08 |
| 40 |  Cyprus Cyprus |
39.98 |
| 41 |  Romania Romania |
39.93 |
| 42 |  Namibia Namibia |
39.93 |
| 43 |  Bolivia Bolivia |
39.84 |
| 44 |  Saint Vincent and the Grenadines Saint Vincent and the Grenadines |
39.14 |
| 45 |  Japan Japan |
39.10 |
| 46 |  Australia Australia |
38.94 |
| 47 |  Ecuador Ecuador |
38.07 |
| 48 |  Moldova Moldova |
37.96 |
| 49 |  United States United States |
37.92 |
| 50 |  Mongolia Mongolia |
37.50 |
| 51 |  Grenada Grenada |
37.09 |
| 52 |  Russia Russia |
36.87 |
| 53 |  Algeria Algeria |
36.79 |
| 54 |  North Macedonia North Macedonia |
36.73 |
| 55 |  Bulgaria Bulgaria |
36.65 |
| 56 |  Solomon Islands Solomon Islands |
35.81 |
| 57 |  Colombia Colombia |
34.65 |
| 58 |  Azerbaijan Azerbaijan |
33.91 |
| 59 |  Tunisia Tunisia |
33.83 |
| 60 |  Seychelles Seychelles |
33.77 |
| 61 |  Kyrgyz Republic Kyrgyz Republic |
33.71 |
| 62 |  Senegal Senegal |
33.55 |
| 63 |  Mozambique Mozambique |
33.24 |
| 64 |  Morocco Morocco |
33.05 |
| 65 |  Jordan Jordan |
33.04 |
| 66 |  South Africa South Africa |
32.98 |
| 67 |  China China |
32.95 |
| 68 |  Eswatini Eswatini |
32.84 |
| 69 |  Türkiye Türkiye |
32.63 |
| 70 |  Trinidad and Tobago Trinidad and Tobago |
32.48 |
| 71 |  Switzerland Switzerland |
31.92 |
| 72 |  El Salvador El Salvador |
31.36 |
| 73 |  Uruguay Uruguay |
31.14 |
| 74 |  Argentina Argentina |
31.02 |
| 75 |  Fiji Fiji |
30.81 |
| 76 |  Mexico Mexico |
30.32 |
| 77 |  Georgia Georgia |
30.26 |
| 78 |  Jamaica Jamaica |
30.04 |
| 79 |  Barbados Barbados |
29.75 |
| 80 |  Saudi Arabia Saudi Arabia |
29.57 |
| 81 |  Suriname Suriname |
29.21 |
| 82 |  Bahrain Bahrain |
29.06 |
| 83 |  Albania Albania |
28.94 |
| 84 |  Rwanda Rwanda |
28.78 |
| 85 |  Oman Oman |
28.70 |
| 86 |  India India |
28.38 |
| 87 |  Burkina Faso Burkina Faso |
27.83 |
| 88 |  Tajikistan Tajikistan |
27.66 |
| 89 |  Uzbekistan Uzbekistan |
27.59 |
| 90 |  Bhutan Bhutan |
27.13 |
| 91 |  Nicaragua Nicaragua |
27.10 |
| 92 |  Chile Chile |
26.73 |
| 93 |  Togo Togo |
26.42 |
| 94 |  Belize Belize |
26.29 |
| 95 |  Cabo Verde Cabo Verde |
26.09 |
| 96 |  Qatar Qatar |
25.98 |
| 97 |  Honduras Honduras |
25.66 |
| 98 |  Philippines Philippines |
24.94 |
| 99 |  Gabon Gabon |
24.77 |
| 100 |  Saint Lucia Saint Lucia |
24.31 |
| 101 |  Malaysia Malaysia |
23.86 |
| 102 |  Kenya Kenya |
23.26 |
| 103 |  Hong Kong SAR Hong Kong SAR |
23.26 |
| 104 |  Guyana Guyana |
23.21 |
| 105 |  Ghana Ghana |
23.18 |
| 106 |  Panama Panama |
23.15 |
| 107 |  Thailand Thailand |
22.71 |
| 108 |  South Korea South Korea |
22.53 |
| 109 |  Burundi Burundi |
22.35 |
| 110 |  Ireland Ireland |
22.31 |
| 111 |  Peru Peru |
22.27 |
| 112 |  Republic of the Congo Republic of the Congo |
21.65 |
| 113 |  United Arab Emirates United Arab Emirates |
21.41 |
| 114 |  Aruba Aruba |
21.23 |
| 115 |  Paraguay Paraguay |
20.99 |
| 116 |  Bahamas Bahamas |
20.97 |
| 117 |  Myanmar Myanmar |
20.67 |
| 118 |  Djibouti Djibouti |
20.62 |
| 119 |  Guinea Guinea |
20.56 |
| 120 |  Côte d’Ivoire Côte d’Ivoire |
20.37 |
| 121 |  Papua New Guinea Papua New Guinea |
20.37 |
| 122 |  Guinea-Bissau Guinea-Bissau |
20.36 |
| 123 |  Antigua and Barbuda Antigua and Barbuda |
19.81 |
| 124 |  Central African Republic Central African Republic |
19.55 |
| 125 |  Pakistan Pakistan |
19.47 |
| 126 |  Dominican Republic Dominican Republic |
19.47 |
| 127 |  Sri Lanka Sri Lanka |
19.32 |
| 128 |  Comoros Comoros |
19.14 |
| 129 |  Vietnam Vietnam |
19.12 |
| 130 |  Tanzania Tanzania |
19.10 |
| 131 |  Costa Rica Costa Rica |
18.87 |
| 132 |  Chad Chad |
18.82 |
| 133 |  Uganda Uganda |
18.69 |
| 134 |  Equatorial Guinea Equatorial Guinea |
18.47 |
| 135 |  Angola Angola |
18.41 |
| 136 |  Benin Benin |
18.05 |
| 137 |  Venezuela Venezuela |
17.58 |
| 138 |  Cambodia Cambodia |
17.26 |
| 139 |  Indonesia Indonesia |
16.84 |
| 140 |  DR Congo DR Congo |
16.73 |
| 141 |  Lebanon Lebanon |
16.48 |
| 142 |  Madagascar Madagascar |
16.21 |
| 143 |  Iran Iran |
14.20 |
| 144 |  Niger Niger |
13.42 |
| 145 |  Guatemala Guatemala |
13.38 |
| 146 |  Nigeria Nigeria |
12.32 |
| 147 |  Bangladesh Bangladesh |
12.03 |
| 148 |  Ethiopia Ethiopia |
9.54 |
| 149 |  Yemen Yemen |
8.91 |
| 150 |  Sudan Sudan |
6.39 |
| 151 |  Haiti Haiti |
5.25 |
Kiribati is a clear outlier, while several Nordic and Western European countries cluster around the 50% mark. By contrast, many large emerging economies devote a substantially smaller share of GDP to public spending.
At first glance, the rankings may seem unusual. Why do small Pacific island nations appear alongside countries such as France, Finland, and Italy?
For countries such as Kiribati and the Marshall Islands, government expenditure is heavily influenced by external aid and grants, which finance a large share of public services despite their relatively small domestic economies. The Lowy Institute’s Pacific Aid Map shows that Kiribati receives significant international development assistance, helping explain why public spending approaches the size of its annual economic output.
Why Rich Countries Also Spend More
A second pattern emerges across Europe. Countries such as Finland (57.7%), France (57.2%), Belgium (54.5%), Italy (50.6%), and Germany (49.4%) maintain extensive welfare systems that provide universal healthcare, public pensions, unemployment insurance, and other social programs. These expenditures naturally raise government spending relative to GDP.
High-income economies also tend to have older populations and rising pension and healthcare costs. This helps explain why many of the world’s wealthiest nations consistently appear near the top of these rankings.
Historically, government expenditure has generally risen alongside economic development as countries expanded education, healthcare, and social insurance systems. However, spending trajectories differ significantly based on policy choices and demographics.
Does Higher Spending Mean Better Outcomes?
Not necessarily. Government spending can improve public services and support long-term economic development, but its impact depends on how effectively resources are allocated and whether spending is financed sustainably. Persistent deficits and rising public debt can create fiscal challenges if government expenditure consistently outpaces revenue.
The composition of spending matters as much as the total. Countries allocate public resources differently, with some emphasizing healthcare, education, and social programs, while others devote more to infrastructure, defense, or debt servicing. As a result, countries with similar levels of government spending can experience very different economic and social outcomes.
Learn More on the Voronoi App
To explore more data-driven insights on global public finances and defense priorities, check out Ranked: Military Spending Growth by Country in 2025 on the Voronoi app.