Europe Was Once Bigger Than the U.S. Economy. What Happened?
Key Takeaways
- In 2026, the European Union’s $23 trillion economy is only 71% the size of the $32.4 trillion U.S. economy.
- In 2008, the EU’s gross domestic product was 131% the size of the U.S. economy.
- The eurozone debt crisis, Brexit, the pandemic, and Russia’s invasion of Ukraine all contributed to the EU’s changing economic trajectory.
The United States and the European Union are the two largest Western economies of the 21st century. Over the past two decades, however, their economic trajectories have diverged significantly.
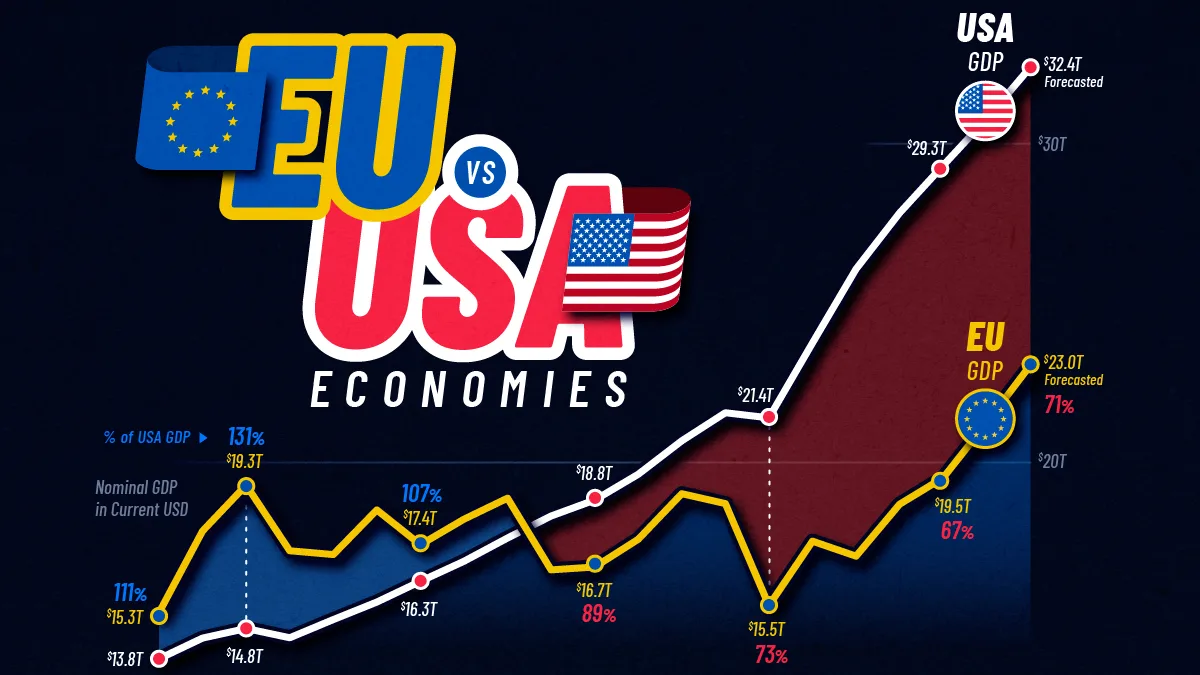
This line chart tracks the gross domestic product (GDP) of the EU and U.S. economies from 2006 to 2026 using the latest figures available from the International Monetary Fund (IMF)’s World Economic Outlook. Figures for 2026 are forecasts.
The Early Rise and Fall of the EU
The 15-member European Union was established in 1993 from precursor organizations such as the European Communities. In 2004, 10 new member states joined, followed by Bulgaria and Romania in 2007.
Aided by the addition of these new member states, along with strong British and German economies, the EU’s total GDP reached $19.3 trillion in 2008. This represented 131% of the U.S. economy that year, which stood at $14.8 trillion. The euro also reached an all-time high in June 2008 at roughly $1.55.
The table below shows the size of the EU economy relative to the U.S. economy from 2006 to 2026.
| Year |  EU GDP ($T) EU GDP ($T) |
 U.S. GDP ($T) U.S. GDP ($T) |
EU % of U.S. GDP |
|---|---|---|---|
| 2006 | 15.27 | 13.82 | 110.5 |
| 2007 | 17.83 | 14.47 | 123.2 |
| 2008 | 19.27 | 14.77 | 130.5 |
| 2009 | 17.21 | 14.48 | 118.9 |
| 2010 | 17.09 | 15.05 | 113.6 |
| 2011 | 18.49 | 15.6 | 118.5 |
| 2012 | 17.40 | 16.25 | 107.1 |
| 2013 | 18.20 | 16.88 | 107.8 |
| 2014 | 18.86 | 17.61 | 107.1 |
| 2015 | 16.61 | 18.3 | 90.8 |
| 2016 | 16.70 | 18.8 | 88.8 |
| 2017 | 17.57 | 19.61 | 89.6 |
| 2018 | 19.00 | 20.66 | 92.0 |
| 2019 | 18.69 | 21.54 | 86.8 |
| 2020 | 15.49 | 21.38 | 72.5 |
| 2021 | 17.51 | 23.73 | 73.8 |
| 2022 | 17.04 | 26.05 | 65.4 |
| 2023 | 18.67 | 27.81 | 67.1 |
| 2024 | 19.50 | 29.3 | 66.6 |
| 2025 | 21.23 | 30.77 | 69.0 |
| 2026 | 23.03 | 32.38 | 71.1 |
The global financial crisis and Great Recession changed the European Union’s fortunes. The newly expanded bloc faced severe challenges as several member-state governments struggled to service their debts or rein in large structural deficits. These countries included eurozone members Cyprus, Greece, Italy, Ireland, Portugal, and Spain.
Through a combination of multilateral bailouts and austerity measures, the EU weathered the crisis. In the years that followed, however, the 28-member bloc’s aggregate GDP contracted, and the $18.3 trillion U.S. economy surpassed it in 2015.
Part of the decline in dollar-denominated GDP also reflected changes in exchange rates as the euro weakened against the U.S. dollar.
Brexit and the Years of Decline
Further challenges followed. In a June 2016 referendum, British voters narrowly chose to make the United Kingdom the first country to withdraw from the European Union. The Brexit process culminated in the UK’s formal withdrawal in January 2020.
Losing the UK dealt another blow to the EU’s aggregate economy. Although the country had never joined the eurozone, it was the EU’s second-largest member economy. Combined with the COVID-19 pandemic, Brexit helped push the bloc’s GDP down to $15.5 trillion in 2020, roughly where it had stood a decade earlier.
As the UK economy has struggled through much of the 2020s, some in London have begun to float the possibility of rejoining the EU. Other European countries, including Albania and Montenegro, remain potential future entrants to the bloc.
The Post-Pandemic Divergence
Since the pandemic, the U.S. and European Union have followed very different trajectories. Despite inflation and high interest rates, the U.S. economy rebounded strongly from COVID and is forecast to reach $32.4 trillion in 2026.
Meanwhile, the EU has faced a combination of rising Chinese industrial competition and an energy crisis stemming from Russia’s 2022 invasion of Ukraine. With economic heavyweight Germany facing protracted stagnation, the EU’s GDP is forecast to reach $23 trillion in 2026.
That leaves the EU economy at just 71% the size of the U.S. economy, a sharp reversal from its position in 2008. Exchange rates account for part of the shift, but weaker growth and a series of economic shocks have also contributed to the widening gap.
Learn More on the Voronoi App
To explore what EU membership meant for one major economy, read Poland’s GDP per capita has more than doubled since it joined the European Union in 2004 on Voronoi.