Ranked: The World’s Top Manufacturing Powers (2005-2025)
Key Takeaways
- In 2005, the U.S. and European Union accounted for nearly half of global manufacturing value added.
- By 2025, China had become the world’s largest manufacturing power by a sizable margin.
- Japan’s share of global manufacturing fell from 13% in 2005 to 5% in 2025.
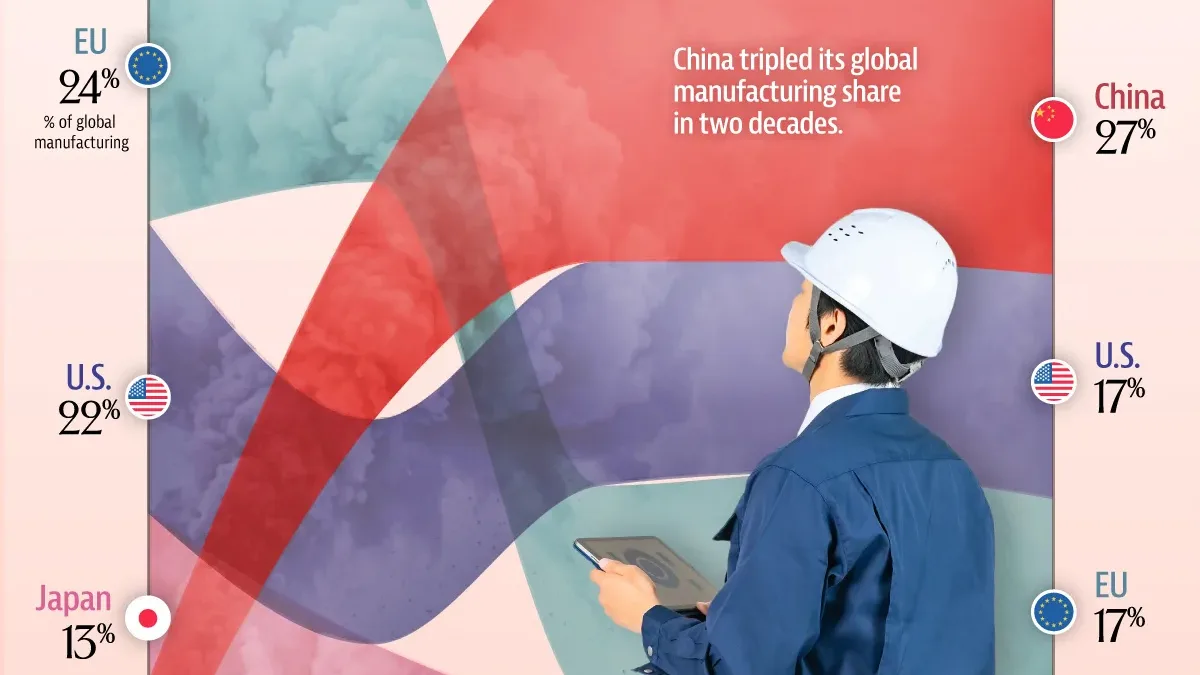
The center of global manufacturing shifted dramatically over the last two decades, led by China’s emergence as the world’s largest manufacturing economy.
This chart visualizes how the global manufacturing shares of eight major economies changed between 2005 and 2025, using the most recent available data from the Bureau of Economic Analysis and the World Bank.
Shares are based on manufacturing value added in current U.S. dollars.
The Traditional Industrial Heavyweights
In 2005, the European Union contributed 24% of global manufacturing value added. Industrial heavyweight Germany, the bloc’s largest economy and a major automotive center, accounted for more than 7% alone.
Across the Atlantic, the U.S. was nearly as large a manufacturer as the EU. Even following decades of deindustrialization, the U.S. remained the world’s largest single-country manufacturer, with heavy industry concentrated in the Midwest.
The table below tracks how each economy’s share of global manufacturing changed from 2005 to 2025.
| Country | Share of global manufacturing | ||||
|---|---|---|---|---|---|
| 2005 | 2010 | 2015 | 2020 | 2025 | |
 China China |
9% | 18% | 26% | 28% | 27% |
 USA USA |
22% | 17% | 17% | 16% | 17% |
 EU EU |
24% | 20% | 17% | 16% | 17% |
 Japan Japan |
13% | 11% | 7% | 8% | 5% |
 South Korea South Korea |
3% | 3% | 3% | 3% | 3% |
 India India |
2% | 3% | 3% | 3% | 3% |
 Mexico Mexico |
2% | 2% | 2% | 2% | 2% |
 Russia Russia |
2% | 2% | 1% | 2% | 2% |
 Other Other |
24% | 25% | 25% | 23% | 24% |
Meanwhile, Japan was responsible for 13% of global manufacturing in 2005. The country has long been known for its electronics, consumer goods, and vehicle production. Industry made up more than a fifth of the Japanese economy at the time.
Following Japan were China at 9% and South Korea at 3%, while India, Mexico, and Russia each accounted for 2%.
The Rise of China
Over 20 years, China’s share of global manufacturing tripled, reaching 27% in 2025. That put it 10 percentage points ahead of both the U.S. and EU.
China’s liberalization and accession to the World Trade Organization (WTO) in 2001 helped facilitate the country’s emergence as an industrial superpower.
A large, relatively low-cost workforce and various regional tax incentives helped attract multinational firms and billions of dollars in manufacturing investment. By 2015, China had become the world’s largest manufacturing economy by share of global value added.
The Other Industrial Powers in 2025
As China’s share surged, the combined share held by the U.S., EU, and Japan declined substantially. Together, the three accounted for 59% of global manufacturing value added in 2005, compared with 39% in 2025.
This reflects a shift in the global distribution of manufacturing value added and does not necessarily indicate a decline in the absolute manufacturing output of each economy.
Mexico, Russia, and South Korea saw their shares of global manufacturing remain relatively stable over the period.
India, meanwhile, increased its share from 2% to 3%. Many Indian policymakers hope to attract more foreign manufacturing investment as the country seeks to expand its role in global supply chains.
Learn More on the Voronoi App
To explore which states power U.S. industry, check out Top 10 U.S. States by Auto Manufacturing Jobs on Voronoi.