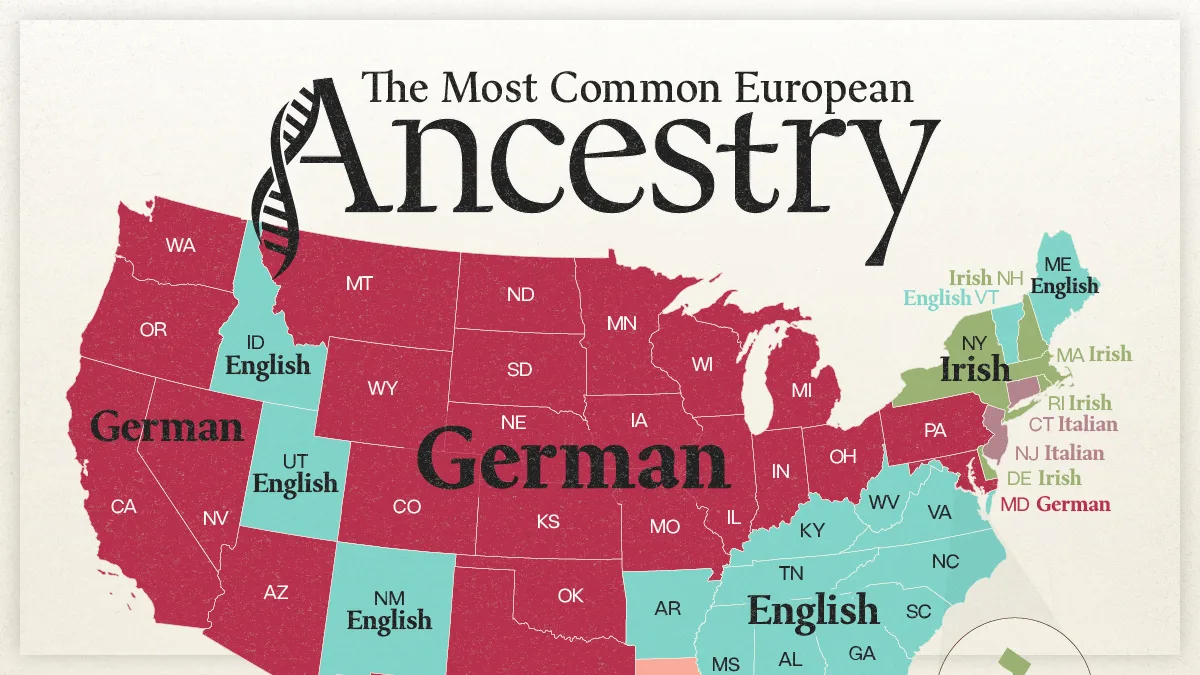
Mapped: The Most Common European Ancestry by U.S. State
Key Takeaways
- German ancestry ranks first in 27 states, dominating much of the Midwest, Great Plains, and West.
- English ancestry leads across much of the South, while Irish and Italian ancestry are concentrated among Northeastern states.
- Louisiana is the only state where French is the largest self-reported European ancestry.
Americans report a wide range of European roots, but a handful of ancestry groups emerge as the largest across most states.
This visualization maps the largest self-reported European ancestry group in every U.S. state and the District of Columbia. Ancestry refers to a person’s ethnic origin, descent, roots, or heritage rather than simply their birthplace.
The data for this visualization comes from the U.S. Census Bureau’s 2024 American Community Survey.
German Ancestry Dominates the Map
German ancestry has the widest geographic reach of any group on the map, ranking first in 27 states from Alaska to Florida.
| State | Largest self-reported ancestry group (2024) |
|---|---|
| Alabama |  English English |
| Alaska |  German German |
| Arizona | German |
| Arkansas | English |
| California | German |
| Colorado | German |
| Connecticut |  Italian Italian |
| Delaware |  Irish Irish |
| District of Columbia | Irish |
| Florida | German |
| Georgia | English |
| Hawaii | German |
| Idaho | English |
| Illinois | German |
| Indiana | German |
| Iowa | German |
| Kansas | German |
| Kentucky | English |
| Louisiana |  French French |
| Maine | English |
| Maryland | German |
| Massachusetts | Irish |
| Michigan | German |
| Minnesota | German |
| Mississippi | English |
| Missouri | German |
| Montana | German |
| Nebraska | German |
| Nevada | German |
| New Hampshire | Irish |
| New Jersey | Italian |
| New Mexico | English |
| New York | Irish |
| North Carolina | English |
| North Dakota | German |
| Ohio | German |
| Oklahoma | German |
| Oregon | German |
| Pennsylvania | German |
| Rhode Island | Irish |
| South Carolina | English |
| South Dakota | German |
| Tennessee | English |
| Texas | German |
| Utah | English |
| Vermont | English |
| Virginia | English |
| Washington | German |
| West Virginia | English |
| Wisconsin | German |
| Wyoming | German |
The pattern reflects one of the largest migration movements in U.S. history. More than 5 million Germans immigrated to the United States during the 19th century, driven by economic hardship and political upheaval at home as transatlantic travel became faster and more accessible.
Many settled across the Midwest and Great Plains, helping establish large German-American communities in states such as Wisconsin, Minnesota, Iowa, Nebraska, and the Dakotas. Their descendants later spread across the country.
In fact, as shown in this graphic, German remains the most widely spoken non-English, non-Spanish language across several Plains and Mountain West states, including Montana, Wyoming, Idaho, Iowa, and North Dakota.
English Ancestry Leads Across Much of the South
English is the largest self-reported ancestry in 15 states, making it the second-most common leader on the map.
Its strongest concentration is in the South and Appalachia, including Alabama, Arkansas, Georgia, Kentucky, Mississippi, Tennessee, Virginia, and West Virginia. English also ranks first in several states farther west, including Idaho and Utah.
Because English migration stretches back to the earliest period of European settlement in what became the United States, these ancestry ties can extend across many generations.
Irish, Italian, and French Strongholds Stand Out
Irish ancestry ranks first in five states: Delaware, Massachusetts, New Hampshire, New York, and Rhode Island. It also ranks first in the District of Columbia.
Its prominence in the Northeast reflects large-scale Irish immigration during the 19th century and the communities that developed around major East Coast cities.
Italian ancestry ranks first only in Connecticut and New Jersey, highlighting the particularly strong Italian-American roots of the Northeast.
Louisiana is the map’s only French-led state, reflecting its distinct colonial history and the lasting influence of French settlement.
Learn More on the Voronoi App 
If you enjoyed today’s post, check out Mapped: U.S. Population Change by State Through 2040 on Voronoi.