Ranked: Housing Costs in Every U.S. State in 2026
Key Takeaways
- Hawaii has the highest housing cost index at 302.4, more than three times the national benchmark.
- Massachusetts ranks second at 217.5, followed by the District of Columbia and California.
- Texas stands out among large states, with housing costs 22.3% below the national average.
Housing costs differ dramatically depending on where Americans live, with some states registering more than double the national benchmark while others sit more than 30% below it.
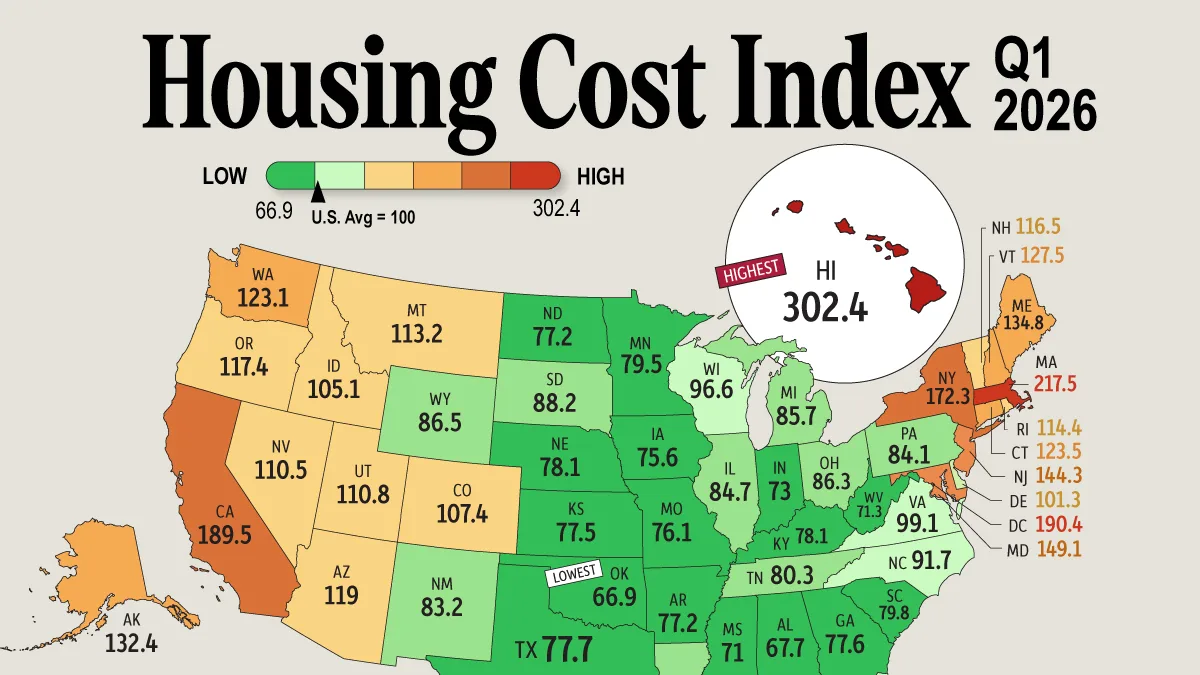
This visualization ranks U.S. states and the District of Columbia by their housing cost index in the first quarter of 2026. An index of 100 represents the national average.
The data for this visualization comes from the Missouri Economic Research and Information Center (MERIC), using figures from the C2ER Cost of Living Index.
Hawaii and the Coasts Lead Housing Costs
Hawaii is the clear outlier, with a housing cost index of 302.4, nearly 85 points above second-place Massachusetts at 217.5.
| Rank | State or District | Housing Cost Index 2026 (U.S. = 100) |
|---|---|---|
| 1 | Hawaii | 302.4 |
| 2 | Massachusetts | 217.5 |
| 3 | District of Columbia | 190.4 |
| 4 | California | 189.5 |
| 5 | New York | 172.3 |
| 6 | Maryland | 149.1 |
| 7 | New Jersey | 144.3 |
| 8 | Maine | 134.8 |
| 9 | Alaska | 132.4 |
| 10 | Vermont | 127.5 |
| 11 | Connecticut | 123.5 |
| 12 | Washington | 123.1 |
| 13 | Arizona | 119.0 |
| 14 | Oregon | 117.4 |
| 15 | New Hampshire | 116.5 |
| 16 | Rhode Island | 114.4 |
| 17 | Montana | 113.2 |
| 18 | Utah | 110.8 |
| 19 | Nevada | 110.5 |
| 20 | Colorado | 107.4 |
| 21 | Idaho | 105.1 |
| 22 | Delaware | 101.3 |
| 23 | Florida | 101.1 |
| 24 | Virginia | 99.1 |
| 25 | Wisconsin | 96.6 |
| 26 | North Carolina | 91.7 |
| 27 | South Dakota | 88.2 |
| 28 | Wyoming | 86.5 |
| 29 | Ohio | 86.3 |
| 30 | Michigan | 85.7 |
| 31 | Illinois | 84.7 |
| 32 | Pennsylvania | 84.1 |
| 33 | Louisiana | 83.3 |
| 34 | New Mexico | 83.2 |
| 35 | Tennessee | 80.3 |
| 36 | South Carolina | 79.8 |
| 37 | Minnesota | 79.5 |
| 38 | Kentucky | 78.1 |
| 38 | Nebraska | 78.1 |
| 40 | Texas | 77.7 |
| 41 | Georgia | 77.6 |
| 42 | Kansas | 77.5 |
| 43 | Arkansas | 77.2 |
| 43 | North Dakota | 77.2 |
| 45 | Missouri | 76.1 |
| 46 | Iowa | 75.6 |
| 47 | Indiana | 73.0 |
| 48 | West Virginia | 71.3 |
| 49 | Mississippi | 71.0 |
| 50 | Alabama | 67.7 |
| 51 | Oklahoma | 66.9 |
The District of Columbia ranks third at 190.4, followed closely by California at 189.5.
New York rounds out the top five at 172.3, putting housing costs 72.3% above the national average.
Many of these markets face a combination of expensive land, high construction costs, dense population centers, and geographic or regulatory constraints on new housing supply.
A Wide Gap Between High- and Low-Cost States
At the opposite end of the ranking, Oklahoma has the lowest housing cost index at 66.9, putting it 33.1% below the national benchmark.
Alabama and Mississippi also rank among the least expensive markets, with indexes of 67.7 and 71.0, respectively.
In general, lower-cost housing is concentrated across parts of the South and Midwest, where land tends to be more abundant and construction and development costs can be lower.
Many Large States Remain Below Average
Some of America’s largest states remain relatively inexpensive by this measure.
Texas has a housing cost index of 77.7, putting it 22.3% below the national average, while Georgia comes in at 77.6. North Carolina is also below average at 91.7.
By comparison, Florida sits almost exactly at the national benchmark with an index of 101.1, highlighting the wide differences in housing costs even among fast-growing Sun Belt states.
North Dakota is another relatively inexpensive market, with an index of 77.2, or 22.8% below the national average.
Missouri, Iowa, and Indiana are similarly inexpensive, with readings of 76.1, 75.6, and 73.0, respectively.
Learn More on the Voronoi App 
If you enjoyed today’s post, check out Mapped: Every U.S. State’s Economy, Matched to a Country on Voronoi.