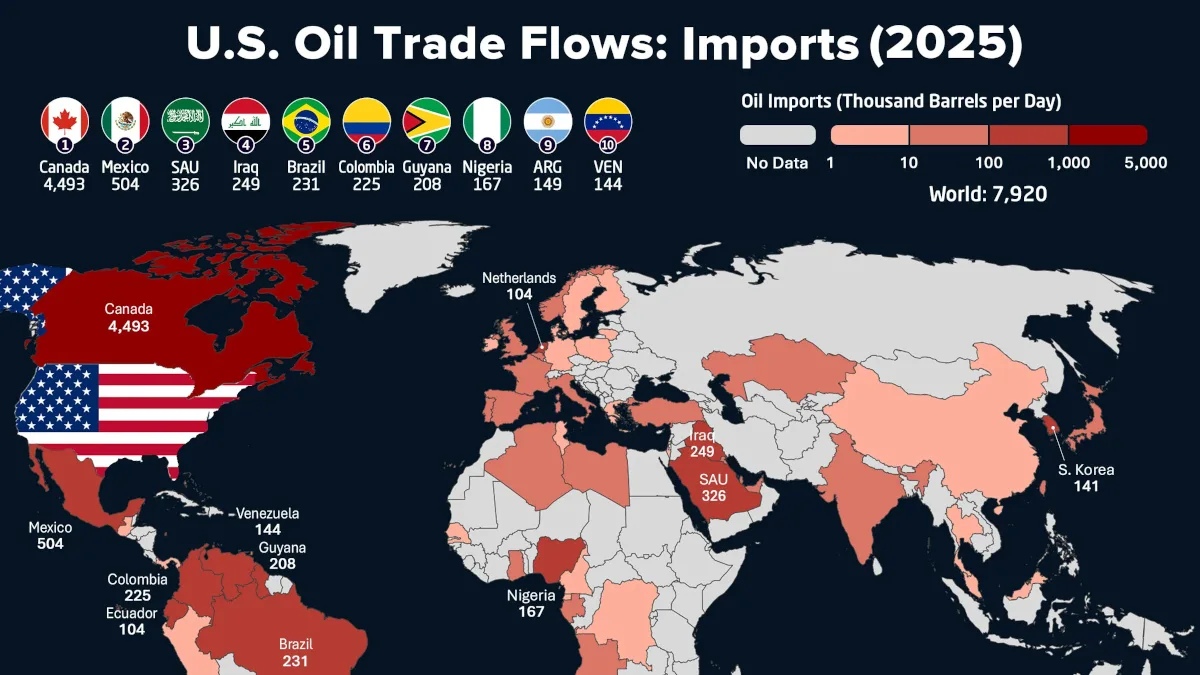
Mapped: America’s Oil Imports by Country
Key Takeaways
- The U.S. imported 7.9 million barrels of oil per day in 2025, including crude oil and petroleum products.
- Canada supplied nearly 57% of those imports, far more than any other country.
- Mexico ranked second, followed by Saudi Arabia, Iraq, and Brazil.
Canada towers over every other source of U.S. oil imports.
In 2025, the U.S. imported nearly nine times more oil from Canada than from Mexico, its second-largest supplier. The gap reflects decades of integrated pipelines, refinery infrastructure, and cross-border energy trade.
The data for this map comes from the U.S. Energy Information Administration’s imports by country of origin and includes both crude oil and petroleum products.
Canada Accounts for 57% of U.S. Oil Imports
Canada was by far the largest source of U.S. oil imports in 2025, supplying 4.5 million barrels per day.
The table below ranks U.S. oil import origins in 2025 by average daily volume, measured in thousands of barrels per day:
| Rank | Country | U.S. Oil Imports in 2025 (Thousand Barrels per Day) |
|---|---|---|
| 1 |  Canada Canada |
4,493 |
| 2 |  Mexico Mexico |
504 |
| 3 |  Saudi Arabia Saudi Arabia |
326 |
| 4 |  Iraq Iraq |
249 |
| 5 |  Brazil Brazil |
231 |
| 6 |  Colombia Colombia |
225 |
| 7 |  Guyana Guyana |
208 |
| 8 |  Nigeria Nigeria |
167 |
| 9 |  Argentina Argentina |
149 |
| 10 |  Venezuela Venezuela |
144 |
| 11 |  South Korea South Korea |
141 |
| 12 |  Ecuador Ecuador |
104 |
| 13 |  Netherlands Netherlands |
104 |
| 14 |  India India |
95 |
| 15 |  United Kingdom United Kingdom |
92 |
| 16 |  Libya Libya |
69 |
| 17 |  Algeria Algeria |
68 |
| 18 |  Bahamas Bahamas |
64 |
| 19 |  Kuwait Kuwait |
46 |
| 20 |  United Arab Emirates United Arab Emirates |
36 |
| 21 |  Trinidad and Tobago Trinidad and Tobago |
36 |
| 22 |  Belgium Belgium |
35 |
| 23 |  Angola Angola |
34 |
| 24 |  Norway Norway |
32 |
| 25 |  Kazakhstan Kazakhstan |
31 |
| 26 |  Gabon Gabon |
20 |
| 27 |  Spain Spain |
19 |
| 28 |  Qatar Qatar |
17 |
| 29 |  Portugal Portugal |
16 |
| 30 |  France France |
15 |
| 31 |  Taiwan Taiwan |
14 |
| 32 |  Türkiye Türkiye |
14 |
| 33 |  Japan Japan |
12 |
| 34 |  Singapore Singapore |
11 |
| 35 |  Ghana Ghana |
10 |
| 36 |  Italy Italy |
10 |
| 37 |  Lithuania Lithuania |
7 |
| 38 |  China China |
6 |
| 39 |  Senegal Senegal |
6 |
| 40 |  DR Congo DR Congo |
5 |
| 41 |  Germany Germany |
5 |
| 42 |  Peru Peru |
5 |
| 43 |  Israel Israel |
4 |
| 44 |  Cameroon Cameroon |
3 |
| 45 |  Finland Finland |
3 |
| 46 |  Malaysia Malaysia |
3 |
| 47 |  Sweden Sweden |
3 |
| 48 |  Thailand Thailand |
3 |
| 49 |  Bahrain Bahrain |
2 |
| 50 |  Chile Chile |
2 |
| 51 |  Guatemala Guatemala |
2 |
| 52 |  Côte d’Ivoire Côte d’Ivoire |
2 |
| 53 |  Tunisia Tunisia |
2 |
| 54 |  U.S. Virgin Islands U.S. Virgin Islands |
2 |
| 55 |  Equatorial Guinea Equatorial Guinea |
1 |
| 56 |  Brunei Brunei |
1 |
| 57 |  Denmark Denmark |
1 |
| 58 |  Greece Greece |
1 |
| 59 |  Ireland Ireland |
1 |
| 60 |  Panama Panama |
1 |
| 61 |  Poland Poland |
1 |
Canada’s 4.5 million bpd was more than three times the combined total of Mexico, Saudi Arabia, Iraq, and Brazil, the next four largest suppliers.
Geography and refinery infrastructure help explain that enormous lead.
Alberta’s oil sands produce heavy, sour crude, and major pipelines carry that oil south into the United States. Midwest refineries were built around that supply: Canadian barrels account for essentially all of the region’s crude imports and more than 70% of what its refineries run. Many of these facilities have coking units designed to turn heavy crude into lighter fuels.
That makes Canadian crude a natural complement to the lighter, sweeter oil produced by many U.S. shale fields.
Landlocked Canadian crude has also historically sold at a discount to U.S. benchmark grades. Until the Trans Mountain expansion opened additional access to the Pacific Coast in 2024, Canadian producers had fewer options for reaching overseas buyers.
Why Does the U.S. Still Import Millions of Barrels of Oil?
The U.S. is one of the world’s largest oil producers, so why import 7.9 million barrels per day?
One reason is that crude oils are not interchangeable. Much of the oil produced by U.S. shale fields is relatively light and sweet, while many American refineries were designed or upgraded to process heavier crude. Canada’s oil sands provide enormous volumes of that heavier feedstock through an established cross-border pipeline network.
This helps explain why the U.S. can produce and export large volumes of oil while simultaneously importing millions of barrels each day.
Learn More on the Voronoi App
To learn more about international oil trade, check out this graphic which breaks down Europe’s oil imports by country on Voronoi.