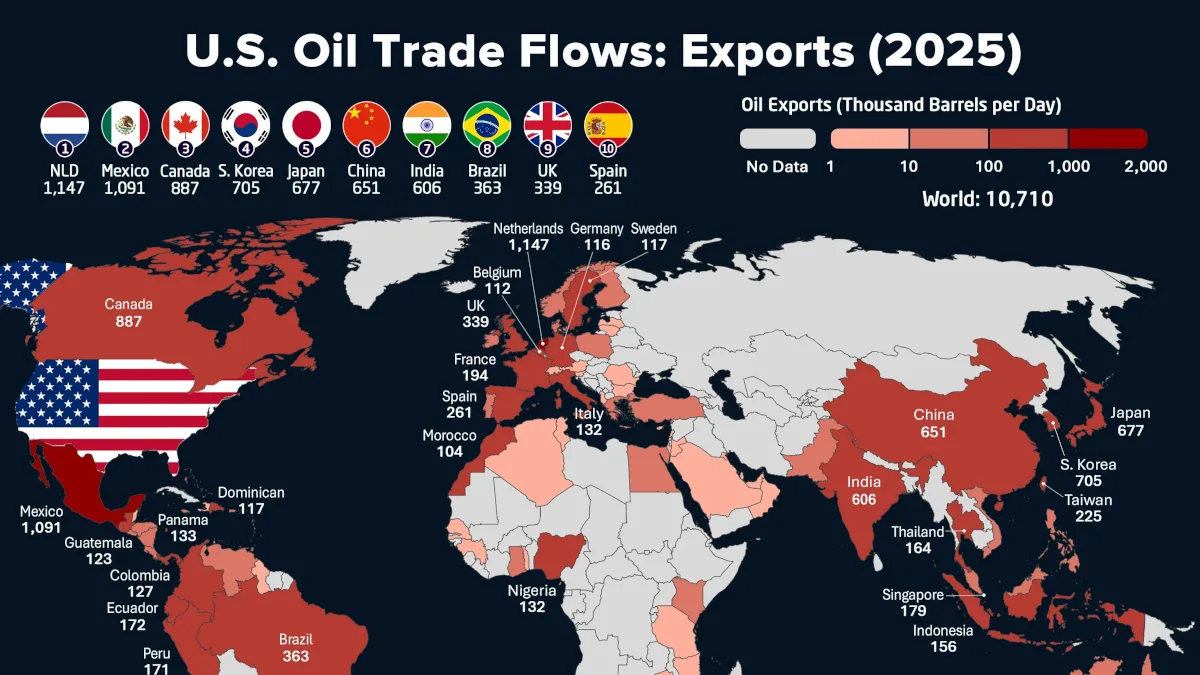
Mapped: The Biggest Buyers of U.S. Oil
Key Takeaways
- The U.S. exported 10.7 million barrels of oil per day in 2025, including crude oil and petroleum products.
- The Netherlands was the top destination at 1.15 million barrels per day, narrowly ahead of Mexico at 1.09 million.
- The top five destinations accounted for about 42% of U.S. oil exports, reflecting a geographically diverse customer base.
U.S. oil exports reached countries across six continents in 2025, with no single destination accounting for an overwhelming share of the total.
The Netherlands and Mexico were the two largest buyers, each receiving more than one million barrels per day. Canada, South Korea, and Japan rounded out the top five.
The data for this map comes from the U.S. Energy Information Administration’s exports by destination and includes both crude oil and petroleum products.
The Netherlands and Mexico Lead U.S. Oil Exports
The Netherlands ranked first among U.S. oil export destinations in 2025 at 1.15 million barrels per day, with Mexico close behind at 1.09 million.
The table below ranks U.S. oil export destinations in 2025 by average daily volume, measured in thousands of barrels per day:
| Rank | Country | U.S. Oil Exports in 2025 (Thousand Barrels per Day) |
|---|---|---|
| 1 |  Netherlands Netherlands |
1,147 |
| 2 |  Mexico Mexico |
1,091 |
| 3 |  Canada Canada |
887 |
| 4 |  South Korea South Korea |
705 |
| 5 |  Japan Japan |
677 |
| 6 |  China China |
651 |
| 7 |  India India |
606 |
| 8 |  Brazil Brazil |
363 |
| 9 |  United Kingdom United Kingdom |
339 |
| 10 |  Spain Spain |
261 |
| 11 |  Taiwan Taiwan |
225 |
| 12 |  France France |
194 |
| 13 |  Chile Chile |
189 |
| 14 |  Singapore Singapore |
179 |
| 15 |  Ecuador Ecuador |
172 |
| 16 |  Peru Peru |
171 |
| 17 |  Thailand Thailand |
164 |
| 18 |  Indonesia Indonesia |
156 |
| 19 |  Panama Panama |
133 |
| 20 |  Italy Italy |
132 |
| 21 |  Nigeria Nigeria |
132 |
| 22 |  Colombia Colombia |
127 |
| 23 |  Guatemala Guatemala |
123 |
| 24 |  Dominican Republic Dominican Republic |
117 |
| 25 |  Sweden Sweden |
117 |
| 26 |  Germany Germany |
116 |
| 27 |  Belgium Belgium |
112 |
| 28 |  Morocco Morocco |
104 |
| 29 |  Honduras Honduras |
83 |
| 30 |  Norway Norway |
82 |
| 31 |  Egypt Egypt |
76 |
| 32 |  Malaysia Malaysia |
65 |
| 33 |  Costa Rica Costa Rica |
64 |
| 34 |  Türkiye Türkiye |
58 |
| 35 |  Bahamas Bahamas |
55 |
| 36 |  El Salvador El Salvador |
55 |
| 37 |  U.S. Virgin Islands U.S. Virgin Islands |
48 |
| 38 |  Vietnam Vietnam |
44 |
| 39 |  South Africa South Africa |
43 |
| 40 |  Argentina Argentina |
42 |
| 41 |  Trinidad and Tobago Trinidad and Tobago |
41 |
| 42 |  Australia Australia |
40 |
| 43 |  Ireland Ireland |
37 |
| 44 |  Kenya Kenya |
35 |
| 45 |  Denmark Denmark |
34 |
| 46 |  Finland Finland |
32 |
| 47 |  Jamaica Jamaica |
27 |
| 48 |  Nicaragua Nicaragua |
26 |
| 49 |  Poland Poland |
26 |
| 50 |  Saint Lucia Saint Lucia |
25 |
| 51 |  Uruguay Uruguay |
23 |
| 52 |  Côte d’Ivoire Côte d’Ivoire |
22 |
| 53 |  Portugal Portugal |
20 |
| 54 |  Venezuela Venezuela |
18 |
| 55 |  Pakistan Pakistan |
14 |
| 56 |  Puerto Rico Puerto Rico |
14 |
| 57 |  Ghana Ghana |
13 |
| 58 |  Greece Greece |
13 |
| 59 |  Curacao Curacao |
12 |
| 60 |  Philippines Philippines |
12 |
| 61 |  Paraguay Paraguay |
11 |
| 62 |  Bulgaria Bulgaria |
9 |
| 63 |  Israel Israel |
9 |
| 64 |  Gibraltar Gibraltar |
7 |
| 65 |  Latvia Latvia |
7 |
| 66 |  Oman Oman |
6 |
| 67 |  Switzerland Switzerland |
6 |
| 68 |  Togo Togo |
6 |
| 69 |  United Arab Emirates United Arab Emirates |
6 |
| 70 |  Belize Belize |
5 |
| 71 |  Senegal Senegal |
5 |
| 72 |  Aruba Aruba |
4 |
| 73 |  Haiti Haiti |
4 |
| 74 |  Jordan Jordan |
4 |
| 75 |  Lithuania Lithuania |
3 |
| 76 |  Maldives Maldives |
3 |
| 77 |  Slovenia Slovenia |
3 |
| 78 |  Tunisia Tunisia |
3 |
| 79 |  Algeria Algeria |
2 |
| 80 |  Antigua and Barbuda Antigua and Barbuda |
2 |
| 81 |  Austria Austria |
2 |
| 82 |  Mozambique Mozambique |
2 |
| 83 |  New Zealand New Zealand |
2 |
| 84 |  Albania Albania |
1 |
| 85 |  Cayman Islands Cayman Islands |
1 |
| 86 |  Cyprus Cyprus |
1 |
| 87 |  Dominica Dominica |
1 |
| 88 |  Guinea Guinea |
1 |
| 89 |  Guyana Guyana |
1 |
| 90 |  Kuwait Kuwait |
1 |
| 91 |  Lebanon Lebanon |
1 |
| 92 |  Malta Malta |
1 |
| 93 |  Namibia Namibia |
1 |
| 94 |  Qatar Qatar |
1 |
| 95 |  Romania Romania |
1 |
| 96 |  Saudi Arabia Saudi Arabia |
1 |
| 97 |  Tanzania Tanzania |
1 |
| 98 |  Turks and Caicos Islands Turks and Caicos Islands |
1 |
| 99 |  British Virgin Islands British Virgin Islands |
1 |
Canada ranked third at 887,000 barrels per day, followed by South Korea at 705,000 and Japan at 677,000.
Together, the top five markets received 4.51 million barrels per day, or about 42% of total U.S. oil exports.
Why the Netherlands Ranks First
The Netherlands’ position at the top of the ranking partly reflects Rotterdam’s role as a gateway to the wider European oil market.
Rotterdam is Europe’s largest port and a major hub for crude oil, petroleum products, storage, and refining. Oil unloaded there can be processed locally or moved onward by pipeline and barge to Germany and other parts of northwestern Europe.
As a result, oil recorded as exported to the Netherlands is not necessarily consumed there.
Europe’s shift away from Russian oil has also increased demand for alternative suppliers. After the European Union banned most seaborne Russian crude imports in late 2022, U.S. crude became an increasingly important replacement source for European refiners.
The Netherlands has remained one of the largest destinations for U.S. crude oil since then.
Mexico’s Oil Trade With the U.S. Works Differently
Mexico’s 1.09 million barrels per day reflects a different kind of energy relationship.
Mexico exports much of its own heavier crude oil to the United States while importing large volumes of refined petroleum products, including gasoline and diesel, from U.S. Gulf Coast refineries.
This two-way trade reflects differences in refinery capacity and configuration between the two countries. U.S. refineries process Mexican crude while supplying fuels that Mexico’s domestic refining system does not produce in sufficient quantities.
U.S. Oil Exports Reach Buyers Around the World
Unlike U.S. oil imports, which are heavily concentrated in Canada, exports are spread across a much wider range of markets.
Europe and Asia both feature prominently among the largest destinations. South Korea, Japan, China, and India all ranked among the top seven buyers in 2025, while the UK and Spain also appeared in the top 10.
That geographic spread reflects the U.S.’s growing role as a global supplier of both crude oil and refined petroleum products.
Much of the crude produced by U.S. shale fields is relatively light and sweet, making it attractive to overseas refiners. At the same time, the country’s large refining sector exports substantial volumes of gasoline, diesel, and other petroleum products.
Learn More on the Voronoi App
To learn more about international oil trade, check out this graphic which breaks down Europe’s oil imports by country on Voronoi.