A Global Look at Arable Land
Key Takeaways:
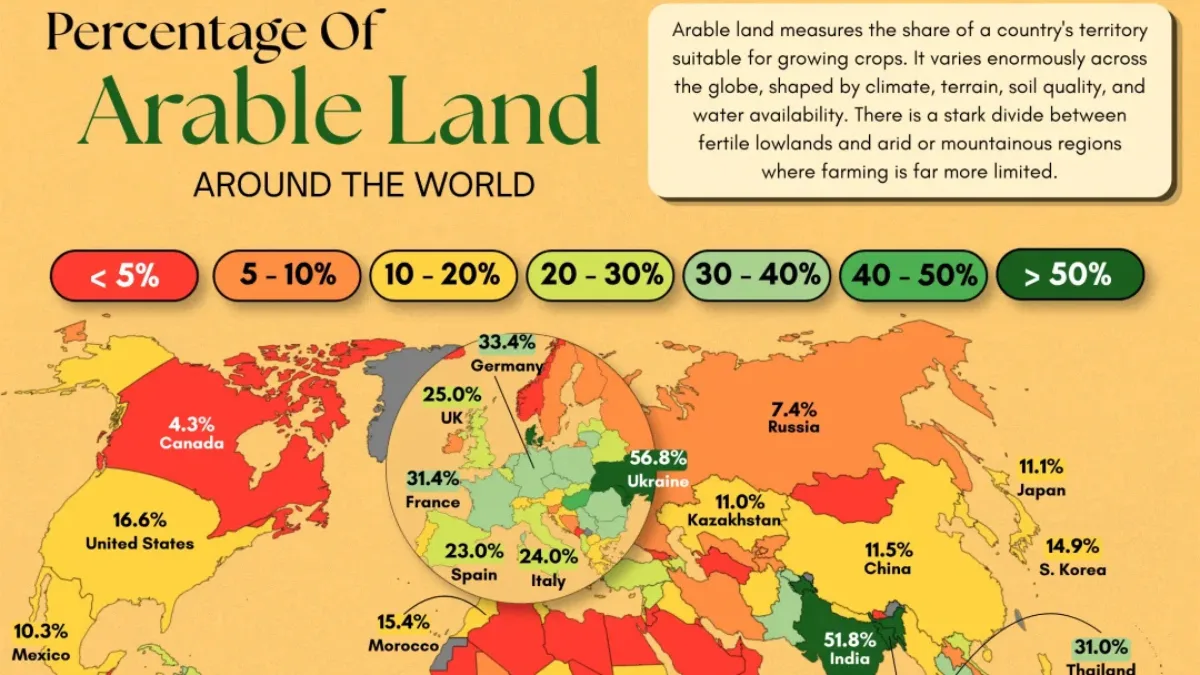
- Bangladesh has the world’s highest share of arable land at 60.6%, followed by Denmark at 59.1%.
- South Asia has several countries with high arable shares, including India (51.8%) and Pakistan (39.3%).
- Arable land is scarce across much of the Middle East, where aridity, water scarcity, and land degradation constrain crop cultivation.
This visualization by Iswardi Ishak maps the percentage of each country’s land area classified as arable, using data from the World Bank Group.
Arable land includes areas under temporary crops, temporary meadows for mowing or pasture, market or kitchen gardens, and temporarily fallow land. The measure is a share of total land area rather than the absolute amount of farmland a country possesses.
Where Arable Land Makes Up the Biggest Share
The table below ranks countries by arable land as a percentage of total land area, based on World Bank data.
| Rank | Country | % of Arable Land out of Total Land Area |
|---|---|---|
| 1 |  Bangladesh Bangladesh |
60.6 |
| 2 |  Denmark Denmark |
59.1 |
| 3 |  Ukraine Ukraine |
56.8 |
| 4 |  Moldova Moldova |
56.8 |
| 5 |  India India |
51.8 |
| 6 |  Burundi Burundi |
51.4 |
| 7 |  Togo Togo |
48.7 |
| 8 |  Rwanda Rwanda |
47.0 |
| 9 |  Hungary Hungary |
45.4 |
| 10 |  Gambia, The Gambia, The |
43.5 |
| 11 |  Malawi Malawi |
42.4 |
| 12 |  Nigeria Nigeria |
40.5 |
| 13 |  Pakistan Pakistan |
39.3 |
| 14 |  Mauritius Mauritius |
37.6 |
| 15 |  Lithuania Lithuania |
36.8 |
| 16 |  Poland Poland |
36.6 |
| 17 |  Romania Romania |
36.5 |
| 18 |  Haiti Haiti |
36.5 |
| 19 |  Comoros Comoros |
34.9 |
| 20 |  El Salvador El Salvador |
34.8 |
| 21 |  Uganda Uganda |
34.4 |
| 22 |  Germany Germany |
33.4 |
| 23 |  San Marino San Marino |
33.1 |
| 24 |  Czechia Czechia |
32.7 |
| 25 |  Bulgaria Bulgaria |
32.1 |
| 26 |  Benin Benin |
31.4 |
| 27 |  France France |
31.4 |
| 28 |  Thailand Thailand |
31.0 |
| 29 |  Serbia Serbia |
31.0 |
| 30 |  Netherlands Netherlands |
30.0 |
| 31 |  Burkina Faso Burkina Faso |
28.9 |
| 32 |  Belgium Belgium |
28.3 |
| 33 |  Cuba Cuba |
28.0 |
| 34 |  Tonga Tonga |
27.8 |
| 35 |  Belarus Belarus |
27.4 |
| 36 |  Slovak Republic Slovak Republic |
27.2 |
| 37 |  Turkiye Turkiye |
26.3 |
| 38 |  Azerbaijan Azerbaijan |
25.3 |
| 39 |  United Kingdom United Kingdom |
25.0 |
| 40 |  Guinea Guinea |
24.4 |
| 41 |  Syrian Arab Republic Syrian Arab Republic |
24.0 |
| 42 |  Italy Italy |
24.0 |
| 43 |  Luxembourg Luxembourg |
23.8 |
| 44 |  Cambodia Cambodia |
23.3 |
| 45 |  Spain Spain |
23.0 |
| 46 |  Malta Malta |
22.8 |
| 47 |  Sri Lanka Sri Lanka |
22.2 |
| 48 |  Sierra Leone Sierra Leone |
21.9 |
| 49 |  Latvia Latvia |
21.9 |
| 50 |  Albania Albania |
21.6 |
| 51 |  Vietnam Vietnam |
21.5 |
| 52 |  Ghana Ghana |
20.7 |
| 53 |  Dominican Republic Dominican Republic |
20.2 |
| 54 |  Senegal Senegal |
19.9 |
| 55 | St. Kitts and Nevis | 19.2 |
| 56 |  Korea, Dem. People’s Rep. Korea, Dem. People’s Rep. |
19.1 |
| 57 |  Philippines Philippines |
18.7 |
| 58 |  Tunisia Tunisia |
18.2 |
| 59 |  Myanmar Myanmar |
16.9 |
| 60 |  Estonia Estonia |
16.6 |
| 61 |  United States United States |
16.6 |
| 62 |  North Macedonia North Macedonia |
16.5 |
| 63 |  Barbados Barbados |
16.3 |
| 64 |  Austria Austria |
16.0 |
| 65 |  Armenia Armenia |
15.7 |
| 66 |  Croatia Croatia |
15.5 |
| 67 |  Morocco Morocco |
15.4 |
| 68 |  Tanzania Tanzania |
15.2 |
| 69 |  Cote d’Ivoire Cote d’Ivoire |
15.1 |
| 70 |  South Korea South Korea |
14.9 |
| 71 |  Argentina Argentina |
14.8 |
| 72 |  Ethiopia Ethiopia |
14.5 |
| 73 |  Guatemala Guatemala |
14.5 |
| 74 |  Greece Greece |
14.4 |
| 75 |  Guinea-Bissau Guinea-Bissau |
14.1 |
| 76 |  Niger Niger |
14.0 |
| 77 |  Maldives Maldives |
13.4 |
| 78 |  Lebanon Lebanon |
13.1 |
| 79 |  Cameroon Cameroon |
13.1 |
| 80 |  Nepal Nepal |
12.6 |
| 81 |  Uruguay Uruguay |
12.6 |
| 82 |  Israel Israel |
12.5 |
| 83 |  Nicaragua Nicaragua |
12.5 |
| 84 |  Cabo Verde Cabo Verde |
12.4 |
| 85 |  Afghanistan Afghanistan |
12.0 |
| 86 |  Lesotho Lesotho |
11.8 |
| 87 |  China China |
11.5 |
| 88 |  Paraguay Paraguay |
11.5 |
| 89 |  Iraq Iraq |
11.4 |
| 90 |  Kenya Kenya |
11.4 |
| 91 |  Sudan Sudan |
11.2 |
| 92 |  Japan Japan |
11.1 |
| 93 |  Jamaica Jamaica |
11.1 |
| 94 |  Kazakhstan Kazakhstan |
11.0 |
| 95 |  Liechtenstein Liechtenstein |
10.8 |
| 96 |  Cyprus Cyprus |
10.6 |
| 97 |  Zimbabwe Zimbabwe |
10.4 |
| 98 |  Mexico Mexico |
10.3 |
| 99 |  Eswatini Eswatini |
10.3 |
| 100 |  Portugal Portugal |
10.1 |
| 101 |  Switzerland Switzerland |
10.0 |
| 102 |  South Africa South Africa |
9.9 |
| 103 |  Iran, Islamic Rep. Iran, Islamic Rep. |
9.7 |
| 104 |  Indonesia Indonesia |
9.4 |
| 105 |  Uzbekistan Uzbekistan |
9.1 |
| 106 |  Honduras Honduras |
9.1 |
| 107 |  Antigua and Barbuda Antigua and Barbuda |
9.1 |
| 108 |  Slovenia Slovenia |
8.9 |
| 109 |  Grenada Grenada |
8.8 |
| 110 |  Dominica Dominica |
8.0 |
| 111 |  Panama Panama |
7.6 |
| 112 |  Timor-Leste Timor-Leste |
7.5 |
| 113 |  Russian Federation Russian Federation |
7.4 |
| 114 |  Finland Finland |
7.4 |
| 115 |  Bosnia and Herzegovina Bosnia and Herzegovina |
7.2 |
| 116 |  Mozambique Mozambique |
7.2 |
| 117 |  West Bank and Gaza West Bank and Gaza |
7.0 |
| 118 |  Mali Mali |
6.8 |
| 119 |  Kyrgyz Republic Kyrgyz Republic |
6.7 |
| 120 |  Brazil Brazil |
6.7 |
| 121 |  Congo, Dem. Rep. Congo, Dem. Rep. |
6.6 |
| 122 |  Ireland Ireland |
6.4 |
| 123 |  Sweden Sweden |
6.2 |
| 124 |  Tajikistan Tajikistan |
6.1 |
| 125 |  Eritrea Eritrea |
5.7 |
| 126 |  Bermuda Bermuda |
5.6 |
| 127 |  Laos Laos |
5.3 |
| 128 |  Liberia Liberia |
5.2 |
| 129 |  Madagascar Madagascar |
5.2 |
| 130 |  Bolivia Bolivia |
5.1 |
| 131 | St. Vincent and the Grenadines | 5.1 |
| 132 |  Zambia Zambia |
5.1 |
| 133 |  Trinidad and Tobago Trinidad and Tobago |
4.9 |
| 134 |  Belize Belize |
4.4 |
| 135 | St. Lucia | 4.4 |
| 136 |  Georgia Georgia |
4.4 |
| 137 |  Canada Canada |
4.3 |
| 138 |  Angola Angola |
4.3 |
| 139 |  Chad Chad |
4.2 |
| 140 |  Fiji Fiji |
4.2 |
| 141 |  Sao Tome and Principe Sao Tome and Principe |
4.2 |
| 142 |  Ecuador Ecuador |
4.1 |
| 143 |  Australia Australia |
4.0 |
| 144 |  South Sudan South Sudan |
3.9 |
| 145 |  Samoa Samoa |
3.9 |
| 146 |  Turkmenistan Turkmenistan |
3.4 |
| 147 |  Costa Rica Costa Rica |
3.3 |
| 148 |  Algeria Algeria |
3.2 |
| 149 |  Egypt Egypt |
3.1 |
| 150 |  Peru Peru |
3.1 |
| 151 |  Venezuela Venezuela |
2.9 |
| 152 |  Central African Republic Central African Republic |
2.9 |
| 153 |  Micronesia, Fed. Sts. Micronesia, Fed. Sts. |
2.9 |
| 154 |  Bahrain Bahrain |
2.6 |
| 155 |  Bhutan Bhutan |
2.6 |
| 156 |  Kiribati Kiribati |
2.5 |
| 157 |  Malaysia Malaysia |
2.4 |
| 158 |  Colombia Colombia |
2.3 |
| 159 |  Jordan Jordan |
2.3 |
| 160 |  Norway Norway |
2.2 |
| 161 |  Yemen Yemen |
2.2 |
| 162 |  New Zealand New Zealand |
2.0 |
| 163 |  Chile Chile |
1.9 |
| 164 |  Equatorial Guinea Equatorial Guinea |
1.9 |
| 165 |  Guam Guam |
1.9 |
| 166 |  Qatar Qatar |
1.8 |
| 167 |  Somalia Somalia |
1.8 |
| 168 |  Vanuatu Vanuatu |
1.6 |
| 169 |  Congo, Rep. Congo, Rep. |
1.6 |
| 170 |  Saudi Arabia Saudi Arabia |
1.6 |
| 171 |  Andorra Andorra |
1.6 |
| 172 |  Gabon Gabon |
1.3 |
| 173 |  Iceland Iceland |
1.2 |
| 174 |  Libya Libya |
1.0 |
| 175 |  Namibia Namibia |
1.0 |
| 176 |  Solomon Islands Solomon Islands |
0.8 |
| 177 |  Bahamas, The Bahamas, The |
0.8 |
| 178 |  Singapore Singapore |
0.8 |
| 179 |  Brunei Darussalam Brunei Darussalam |
0.8 |
| 180 |  Mongolia Mongolia |
0.7 |
| 181 |  Papua New Guinea Papua New Guinea |
0.7 |
| 182 |  United Arab Emirates United Arab Emirates |
0.7 |
| 183 |  Montenegro Montenegro |
0.7 |
| 184 |  Palau Palau |
0.7 |
| 185 |  Guyana Guyana |
0.5 |
| 186 |  Botswana Botswana |
0.5 |
| 187 |  Kuwait Kuwait |
0.4 |
| 188 |  Mauritania Mauritania |
0.4 |
| 189 |  Suriname Suriname |
0.3 |
| 190 |  Seychelles Seychelles |
0.3 |
| 191 |  Oman Oman |
0.3 |
| 192 |  Djibouti Djibouti |
0.1 |
Bangladesh leads at 60.6%, ahead of Denmark (59.1%), Ukraine and Moldova (both 56.8%), and India (51.8%). Several African countries also rank highly, including Burundi, Togo, Rwanda, and Nigeria.
A high arable-land percentage does not necessarily mean a country has more farmland or produces more food. Because this ranking measures arable land as a share of national territory, large countries can have relatively modest percentages while still cultivating enormous areas. This helps explain why the countries that feed the world differ from those with the highest arable-land shares.
The Contrast Between South Asia and the Middle East
South Asia stands out for its extensive river systems and fertile plains, particularly around the Ganges-Brahmaputra and Indus basins. The International Water Management Institute notes that these transboundary water systems are central to regional agricultural productivity.
Agriculture also remains deeply embedded in the region’s economies and livelihoods. In India, for example, small farms remain widespread, while irrigation and intensive cultivation support farming across large areas.
The opposite pattern appears across much of the Middle East. The Arab Land Initiative reports that 92% of the Arab region is hyper-arid, while water scarcity and land degradation put additional pressure on agricultural areas.
Countries with limited rainfall have consequently relied on irrigation and groundwater, technology, and food imports to bridge the gap between domestic production and consumption. A low arable-land share therefore does not by itself determine food security, as access to water, trade, and infrastructure also matter.
Does More Arable Land Mean a Country Is Poorer?
The ranking includes lower-income countries such as Burundi and Malawi alongside wealthier European economies such as Denmark, Hungary, and Lithuania, showing that there is no simple relationship between income and arable-land share.
However, agriculture often plays a larger economic and employment role in developing countries.
Research highlighted by Yale notes that small farms are particularly prevalent in low-income economies, where agricultural employment remains substantial. Geography influences how much land can be cultivated, while farm size, capital, and technology help determine how economically productive that land becomes.
Learn More on the Voronoi App
For another look at how agricultural land is distributed, see The States with the Most Farmland on the Voronoi app.