How Much Do Countries Spend on Defense R&D?
Key Takeaways
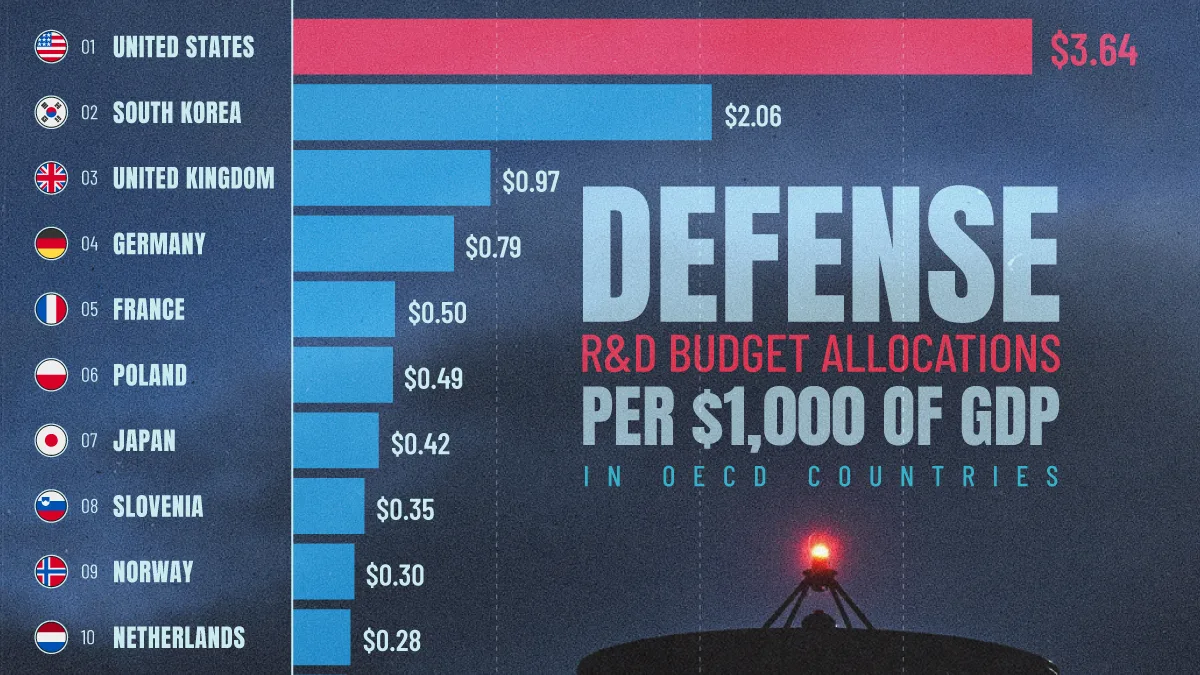
- The U.S. led defense R&D spending per $1,000 of GDP among OECD countries, at $3.64 in 2024.
- South Korea ranked second, allocating $2.06 per $1,000 of GDP to defense R&D.
- Spending falls sharply after the top two, with 20th-ranked Greece allocating just $0.09 per $1,000 of GDP.
Defense research and development is one way countries invest in future military capabilities, from advanced weapons systems to emerging technologies.
This visualization ranks selected OECD countries by defense research and development (R&D) budget allocations per $1,000 of GDP. The data comes from the OECD Economic Outlook, Volume 2026 Issue 1, with figures covering 2024 or the latest available year as of August 2026.
Defense R&D has also historically played an important role in shaping civilian technologies. Research tied to national security has helped support breakthroughs in fields such as computing, aerospace, satellites, medicine, and advanced materials. However, the link between military spending and innovation is not automatic, as secrecy can impede knowledge diffusion, among other factors.
The U.S. Leads by a Wide Margin
The United States ranked first, with defense R&D budget allocations equal to $3.64 per $1,000 of GDP. In absolute terms, the U.S. is also the world’s highest military-spending country by a wide margin, with 2025 spending totaling $954 billion and accounting for one-third of global military spending that year.
The U.S. allocation was nearly 1.8 times South Korea’s and more than 3.7 times the United Kingdom’s, which ranked second and third, respectively.
The table below shows defense R&D budget allocations per $1,000 of GDP for selected OECD countries:
| Rank | Country | Defense Budget R&D Allocation per $1,000 of GDP |
|---|---|---|
| 1 |  United States United States |
$3.64 |
| 2 |  South Korea South Korea |
$2.06 |
| 3 |  United Kingdom United Kingdom |
$0.97 |
| 4 |  Germany Germany |
$0.79 |
| 5 |  France France |
$0.50 |
| 6 |  Poland Poland |
$0.49 |
| 7 |  Japan Japan |
$0.42 |
| 8 |  Slovenia Slovenia |
$0.35 |
| 9 |  Norway Norway |
$0.30 |
| 10 |  Netherlands Netherlands |
$0.28 |
| 11 |  Australia Australia |
$0.26 |
| 12 |  Sweden Sweden |
$0.26 |
| 13 |  Spain Spain |
$0.23 |
| 14 |  Estonia Estonia |
$0.19 |
| 15 |  Türkiye Türkiye |
$0.19 |
| 16 |  Finland Finland |
$0.18 |
| 17 |  Latvia Latvia |
$0.15 |
| 18 |  Belgium Belgium |
$0.10 |
| 19 |  Hungary Hungary |
$0.10 |
| 20 |  Greece Greece |
$0.09 |
Although U.S. military spending as a share of GDP decreased in 2025 compared with the annual average between 2015 and 2022, the Trump administration’s U.S. Department of War announced in April 2026 that its Fiscal Year 2027 (FY27) Defense Budget would request an unprecedented $1.5 trillion, a 42% increase compared with 2026 funding.
Included in that amount are plans to increase defense R&D spending from $16.6 billion in 2026 to $18.7 billion in 2027, with a stated focus on a general science and technology fund.
South Korea and Europe Round Out the Top Five
Allocating $2.06 per $1,000 of GDP to defense R&D, South Korea ranked second, making it the only other OECD country above $2.
South Korea has emerged as one of the world’s fastest-growing arms producers and exporters, supported by sustained government investment in its defense industry.
Reflecting this growth, four South Korean companies appear in the SIPRI Top 100 list of global arms producers with the largest arms sales revenues in 2024. Their combined revenues increased by 30% from 2023 to 2024.
Following South Korea, the ranking drops quickly. The United Kingdom placed third at $0.97 per $1,000 of GDP. Between 2019 and 2024, the UK’s Ministry of Defense tripled its net expenditure on R&D from £1.02 billion to £3.07 billion.
Germany followed in fourth place at $0.79 per $1,000 of GDP, while France ranked fifth at $0.50 per $1,000 of GDP. France and Germany are the European Union’s largest and second-largest defense R&D spenders, respectively.
Most Countries Spend Far Less on Defense R&D
Across the 20 OECD countries shown, the average defense R&D allocation was $0.58 per $1,000 of GDP.
The median was much lower, at $0.27 per $1,000 of GDP, showing how much the top spenders skew the average.
Within the top 20, the drop-off is steep. The U.S. allocation of $3.64 per $1,000 of GDP was more than seven times fifth-ranked France’s $0.50 and more than 40 times 20th-ranked Greece’s $0.09.
Defense R&D intensity varies considerably among wealthy economies because countries may prioritize procurement, active personnel, operations, or research differently.
Learn More on the Voronoi App
If you found this post interesting, check out Which NATO Countries Boosted Defense Spending the Most in 2025? on Voronoi.
- Source: https://www.visualcapitalist.com/defense-rd-spending-per-thousand-dollars-of-gdp-by-oecd-country/