Where Do the World’s Smartest Students Live?
Key Takeaways:
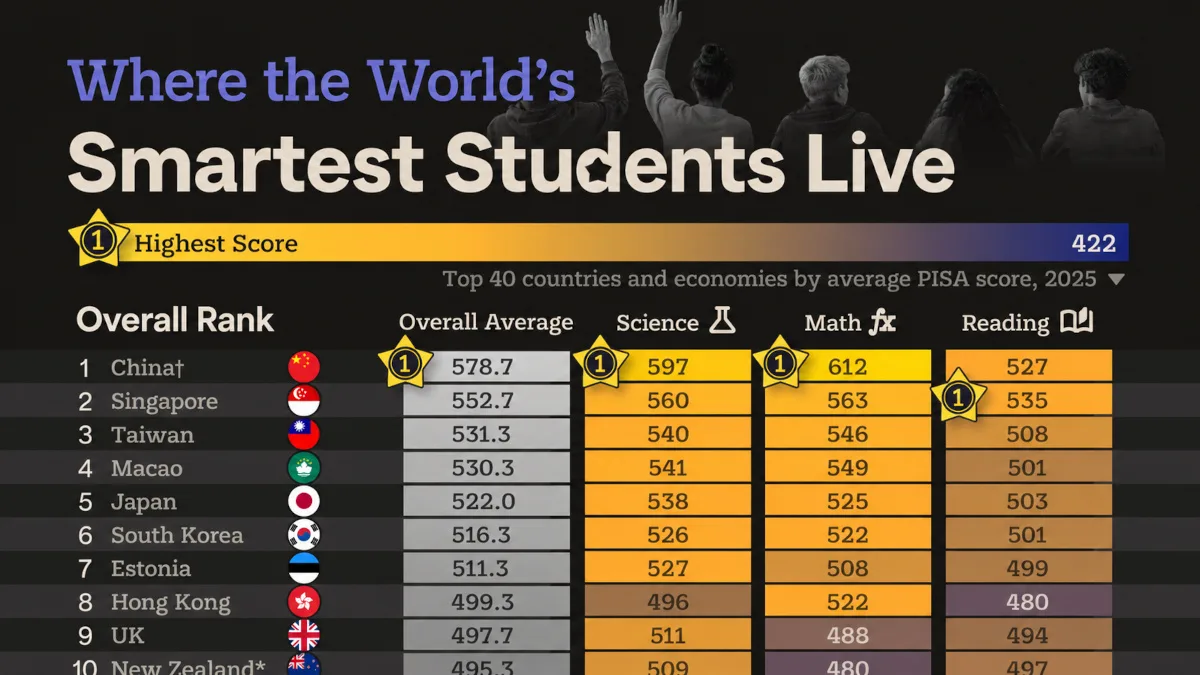
- China’s participating regions lead with an average PISA 2025 test score of 578.7, followed by Singapore (552.7) and Taiwan (531.3).
- East Asian education systems dominate the rankings, particularly in mathematics and science.
- The U.S. ranks 16th overall, performing better in science and reading than in mathematics.
Which countries have the world’s highest-achieving students in mathematics, science, and reading?
This visualization ranks 40 countries and economies using the OECD’s PISA 2025 results, released in September 2026. The assessment measures the skills of 15-year-olds in mathematics, science, and reading across 91 participating education systems.
Student Test Scores by Country, Overall and by Subject
The table below ranks education systems based on OECD PISA 2025 scores in mathematics, science, and reading. The overall ranking uses an equally weighted average of the three subjects, calculated by Visual Capitalist rather than the OECD.
| Rank | Country / Economy | Science | Mathematics | Reading | Three-Subject Average |
|---|---|---|---|---|---|
| 1 |  B-S-J-Z (China) |
597 | 612 | 527 | 578.7 |
| 2 |  Singapore |
560 | 563 | 535 | 552.7 |
| 3 |  Chinese Taipei |
540 | 546 | 508 | 531.3 |
| 4 |  Macao (China) |
541 | 549 | 501 | 530.3 |
| 5 |  Japan |
538 | 525 | 503 | 522.0 |
| 6 |  Korea |
526 | 522 | 501 | 516.3 |
| 7 |  Estonia |
527 | 508 | 499 | 511.3 |
| 8 |  Hong Kong (China) |
496 | 522 | 480 | 499.3 |
| 9 |  United Kingdom |
511 | 488 | 494 | 497.7 |
| 10 |  New Zealand* |
509 | 480 | 497 | 495.3 |
| 11 |  Canada* |
510 | 485 | 490 | 495.0 |
| 12 |  Ireland |
500 | 480 | 500 | 493.3 |
| 13 |  Australia |
509 | 478 | 491 | 492.7 |
| 14 |  Switzerland |
501 | 499 | 470 | 490.0 |
| 15 |  Poland |
495 | 484 | 482 | 487.0 |
| 16 |  United States* |
502 | 463 | 490 | 485.0 |
| 17 |  Finland |
504 | 469 | 474 | 482.3 |
| 18 |  Austria |
497 | 477 | 467 | 480.3 |
| 19 |  Belgium |
490 | 480 | 466 | 478.7 |
| 20 |  Czechia |
490 | 477 | 468 | 478.3 |
| 21 |  Türkiye |
494 | 462 | 472 | 476.0 |
| 22 |  Italy |
483 | 468 | 474 | 475.0 |
| 23 |  Lithuania |
488 | 470 | 464 | 474.0 |
| 24 |  Germany |
486 | 464 | 465 | 471.7 |
| 25 |  Sweden |
485 | 464 | 466 | 471.7 |
| 26 |  Netherlands* |
485 | 483 | 441 | 469.7 |
| 27 |  Denmark |
478 | 471 | 460 | 469.7 |
| 28 |  Portugal |
482 | 460 | 462 | 468.0 |
| 29 |  France |
483 | 458 | 456 | 465.7 |
| 30 |  Slovak Republic |
475 | 469 | 448 | 464.0 |
| 31 |  Hungary |
480 | 459 | 452 | 463.7 |
| 32 |  Slovenia |
484 | 460 | 445 | 463.0 |
| 33 |  Spain |
477 | 457 | 451 | 461.7 |
| 34 |  Croatia |
476 | 455 | 453 | 461.3 |
| 35 |  Luxembourg |
474 | 458 | 443 | 458.3 |
| 36 |  Norway* |
470 | 452 | 453 | 458.3 |
| 37 |  Latvia |
468 | 460 | 430 | 452.7 |
| 38 |  United Arab Emirates |
458 | 453 | 433 | 448.0 |
| 39 |  Iceland |
441 | 450 | 422 | 437.7 |
| 40 |  Israel |
442 | 433 | 436 | 437.0 |
| 41 |  Malta |
453 | 439 | 415 | 435.7 |
| 42 |  Brunei Darussalam |
439 | 435 | 426 | 433.3 |
| 43 |  Ukrainian regions (17 of 27) |
448 | 431 | 418 | 432.3 |
| 44 |  Viet Nam |
457 | 443 | 392 | 430.7 |
| 45 |  Chile |
442 | 403 | 436 | 427.0 |
| 46 |  Greece |
434 | 424 | 423 | 427.0 |
| 47 |  Albania* |
435 | 433 | 408 | 425.3 |
| 48 |  Uruguay |
445 | 405 | 423 | 424.3 |
| 49 |  Qatar |
434 | 416 | 418 | 422.7 |
| 50 |  Montenegro |
435 | 411 | 418 | 421.3 |
| 51 |  Serbia |
429 | 417 | 415 | 420.3 |
| 52 |  Romania |
425 | 419 | 413 | 419.0 |
| 53 |  Mauritius |
438 | 407 | 405 | 416.7 |
| 54 |  Moldova |
422 | 410 | 404 | 412.0 |
| 55 |  Thailand |
432 | 407 | 392 | 410.3 |
| 56 |  Costa Rica |
424 | 387 | 416 | 409.0 |
| 57 |  Georgia |
422 | 416 | 384 | 407.3 |
| 58 |  Kazakhstan |
420 | 414 | 385 | 406.3 |
| 59 |  Mongolia |
424 | 419 | 374 | 405.7 |
| 60 |  Bulgaria |
421 | 405 | 387 | 404.3 |
| 61 |  Mexico |
414 | 388 | 408 | 403.3 |
| 62 |  Malaysia |
419 | 397 | 393 | 403.0 |
| 63 |  Azerbaijan |
409 | 422 | 374 | 401.7 |
| 64 |  Cyprus |
411 | 412 | 379 | 400.7 |
| 65 |  Colombia |
414 | 381 | 399 | 398.0 |
| 66 |  Brazil |
409 | 377 | 408 | 398.0 |
| 67 |  Saudi Arabia |
413 | 390 | 387 | 396.7 |
| 68 |  Peru |
406 | 382 | 390 | 392.7 |
| 69 |  Jordan |
407 | 388 | 363 | 386.0 |
| 70 |  Argentina |
393 | 367 | 389 | 383.0 |
| 71 |  Ecuador |
393 | 366 | 385 | 381.3 |
| 72 |  Indonesia |
389 | 364 | 365 | 372.7 |
| 73 |  North Macedonia |
378 | 380 | 357 | 371.7 |
| 74 |  Philippines |
373 | 371 | 367 | 370.3 |
| 75 |  El Salvador |
385 | 346 | 366 | 365.7 |
| 76 |  Cambodia |
382 | 366 | 347 | 365.0 |
| 77 |  Armenia |
369 | 376 | 348 | 364.3 |
| 78 |  Dushanbe (Tajikistan) |
334 | 382 | 368 | 361.3 |
| 79 |  Lebanon |
372 | 377 | 331 | 360.0 |
| 80 |  Kyrgyzstan |
363 | 364 | 344 | 357.0 |
| 81 |  Palestinian Authority |
359 | 354 | 350 | 354.3 |
| 82 |  Kosovo |
357 | 350 | 340 | 349.0 |
| 83 |  Dominican Republic |
361 | 339 | 346 | 348.7 |
| 84 |  Paraguay |
355 | 334 | 352 | 347.0 |
| 85 |  Morocco |
358 | 355 | 321 | 344.7 |
| 86 |  Guatemala |
351 | 334 | 337 | 340.7 |
| 87 |  Kurdistan Region (Iraq) |
352 | 339 | 312 | 334.3 |
| 88 |  Kenya |
335 | 326 | 320 | 327.0 |
| 89 |  Zambia |
337 | 314 | 325 | 325.3 |
| 90 |  Rwanda |
317 | 312 | 301 | 310.0 |
| 91 |  Uzbekistan |
438 |
*Sampling limitations
East Asia is home to the world’s highest-scoring students, with education systems in the region occupying all six of the top spots. China’s participating regions, Beijing, Shanghai, Jiangsu, and Zhejiang, lead in mathematics and science, while Singapore ranks first in reading.
Why Do East Asian Students Perform So Well?
East Asian education systems often emphasize academic discipline, rigorous curricula, teacher development, and strong parental expectations.
Research on Chinese students’ academic success also highlights cultural attitudes toward effort and achievement. However, these outcomes reflect educational and socioeconomic conditions rather than inherent differences in ability.
China’s results represent four relatively prosperous regions, not the country’s entire student population.
Is North American Education Falling Behind?
Canada ranks 11th with 495 points, while the U.S. places 16th with 485. American students score 502 in science and 490 in reading, but just 463 in mathematics.
A Brookings analysis documents declining American test scores since the 2010s, accelerated by pandemic disruptions. Canada’s education system has also faced concerns about weakening academic performance.
Beyond pandemic-related learning losses, widening socioeconomic disparities, chronic absenteeism, and teacher shortages have placed additional pressure on North American schools. These challenges raise questions about how effectively education systems support struggling students, particularly as several East Asian economies continue to outperform North America despite differences in education spending.
Why Are African Countries Missing From the Top 40?
No African education system appears in this top-40 ranking, though limited PISA participation makes continent-wide comparisons difficult. According to UNESCO, inadequate infrastructure, teacher shortages, unequal access to education, and poverty remain major challenges.
Gender disparities also matter. Girls in some regions face additional barriers involving early marriage, household responsibilities, and school completion. Both education investment and how effectively resources reach disadvantaged students influence learning opportunities.
Learn More on the Voronoi App
For another perspective on global education, explore Comparing Education Levels Across 45 Countries, which examines educational attainment across different countries.