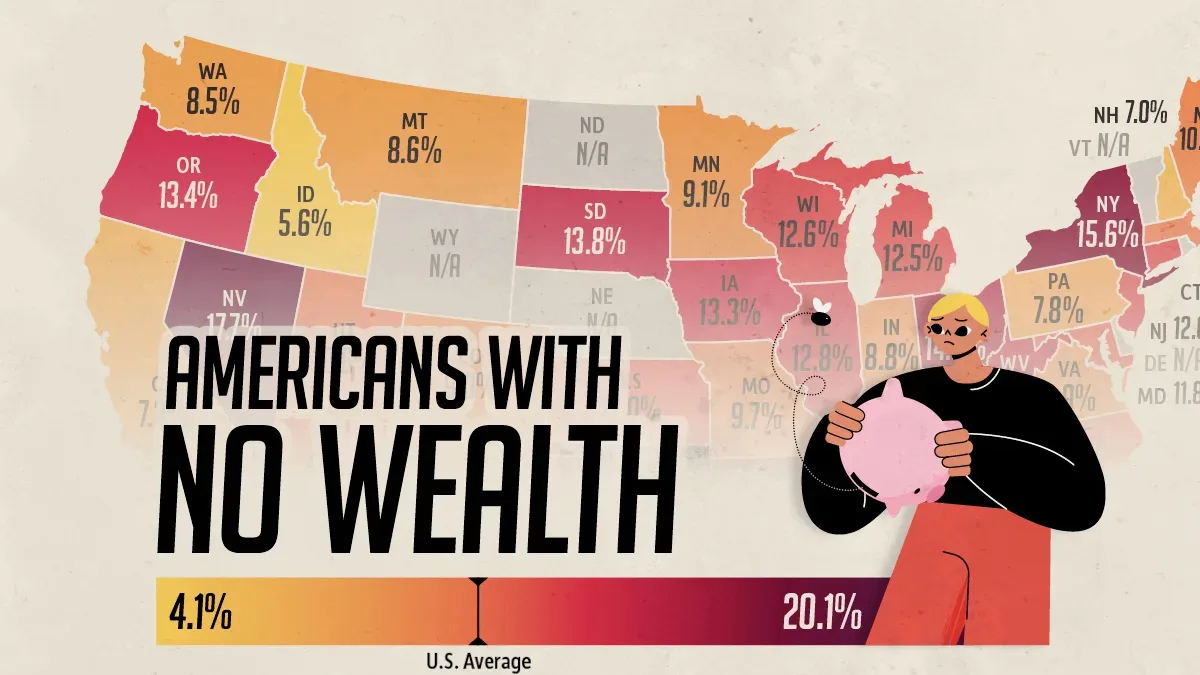
Where Americans Have No Net Wealth
Key Takeaways
- One in five Oklahoma households have zero or negative net worth, the highest share of any state with available data.
- Hawaii sits at the opposite end of the map, with just 4.1% of households estimated to have zero or negative net worth.
- Nationwide, 11.3% of U.S. households have zero or negative net worth.
More than one in 10 U.S. households had no net wealth in 2024, meaning their debts equaled or exceeded the value of their assets.
Unlike income, net worth accounts for both what households own and what they owe, offering a different perspective on financial security.
This map shows how the share varies by state, based on data from the U.S. Census Bureau’s 2025 Survey of Income and Program Participation (SIPP).
Oklahoma Leads, With Almost One in Five Households Affected
At 20.1%, Oklahoma had the highest estimated share of households with zero or negative net worth, nearly nine percentage points above the national rate.
| State | Households With No Net Wealth (%) |
|---|---|
| Oklahoma | 20.1% |
| Nevada | 17.7% |
| Mississippi | 17.6% |
| Arkansas | 15.7% |
| Tennessee | 15.7% |
| New York | 15.6% |
| Ohio | 14.2% |
| South Dakota | 13.8% |
| Kentucky | 13.6% |
| Alabama | 13.5% |
| West Virginia | 13.5% |
| Oregon | 13.4% |
| Iowa | 13.3% |
| Illinois | 12.8% |
| Connecticut | 12.6% |
| New Jersey | 12.6% |
| Wisconsin | 12.6% |
| Michigan | 12.5% |
| Texas | 12.4% |
| Kansas | 12.0% |
| Maryland | 11.8% |
| Florida | 11.6% |
| Georgia | 11.6% |
| Massachusetts | 11.1% |
| North Carolina | 11.1% |
| South Carolina | 10.9% |
| Arizona | 10.6% |
| Utah | 10.6% |
| Maine | 10.3% |
| Louisiana | 10.0% |
| Missouri | 9.7% |
| Minnesota | 9.1% |
| Colorado | 9.0% |
| Virginia | 8.9% |
| Indiana | 8.8% |
| Montana | 8.6% |
| Washington | 8.5% |
| Pennsylvania | 7.8% |
| California | 7.3% |
| New Hampshire | 7.0% |
| New Mexico | 6.0% |
| Idaho | 5.6% |
| Hawaii | 4.1% |
| Alaska | N/A |
| Delaware | N/A |
| Nebraska | N/A |
| North Dakota | N/A |
| Rhode Island | N/A |
| Vermont | N/A |
| Wyoming | N/A |
 U.S. Average |
11.3% |
Lower incomes and higher poverty rates may help explain this result. According to 2024 Census data compiled by KFF, Oklahoma’s median household income was $66,148, compared with $81,604 nationwide. Its poverty rate was also higher, at 14.9% versus 12.1% nationally.
An estimated 43% of Oklahoma households lacked sufficient income to cover basic living expenses in 2024, potentially limiting their ability to build wealth.
Nevada (17.7%) and Mississippi (17.6%) followed, while Arkansas and Tennessee were tied at 15.7%. New York was close behind at 15.6%, showing that high rates were not confined to one region.
Hawaii and Idaho Show the Lowest Shares
Hawaii had the lowest estimated share of households with zero or negative net worth, at just 4.1%.
Higher incomes and substantial housing equity may help explain this result. Hawaii’s median household income was $100,745 in 2024, compared with $81,604 nationally.
A 2024 Unison report using CoreLogic data estimated median homeowner equity in Hawaii at $564,728, the highest among states.
However, high housing wealth does not necessarily mean greater affordability. The University of Hawaii Economic Research Organization found that fewer than one in four households could afford a mortgage on the state’s median-priced single-family home in 2024.
Idaho (5.6%) and New Mexico (6.0%) also ranked near the bottom, followed by New Hampshire (7.0%) and California (7.3%).
The National Average Hides a Patchwork of Outcomes
The figures reveal striking differences even between some of America’s largest states.
In California, 7.3% of households had zero or negative net worth, compared with 15.6% in New York, more than twice the share. Florida and Georgia both stood at 11.6%, just above the national average, while North Carolina was slightly below it at 11.1%.
Seven states (Alaska, Delaware, Nebraska, North Dakota, Rhode Island, Vermont, and Wyoming) are marked N/A because sample sizes were insufficient for reliable estimates.
Learn More on the Voronoi App
If you enjoyed today’s post, check out The Average Middle Class Family in the U.S. Pays $17.9K in Taxes on Voronoi.