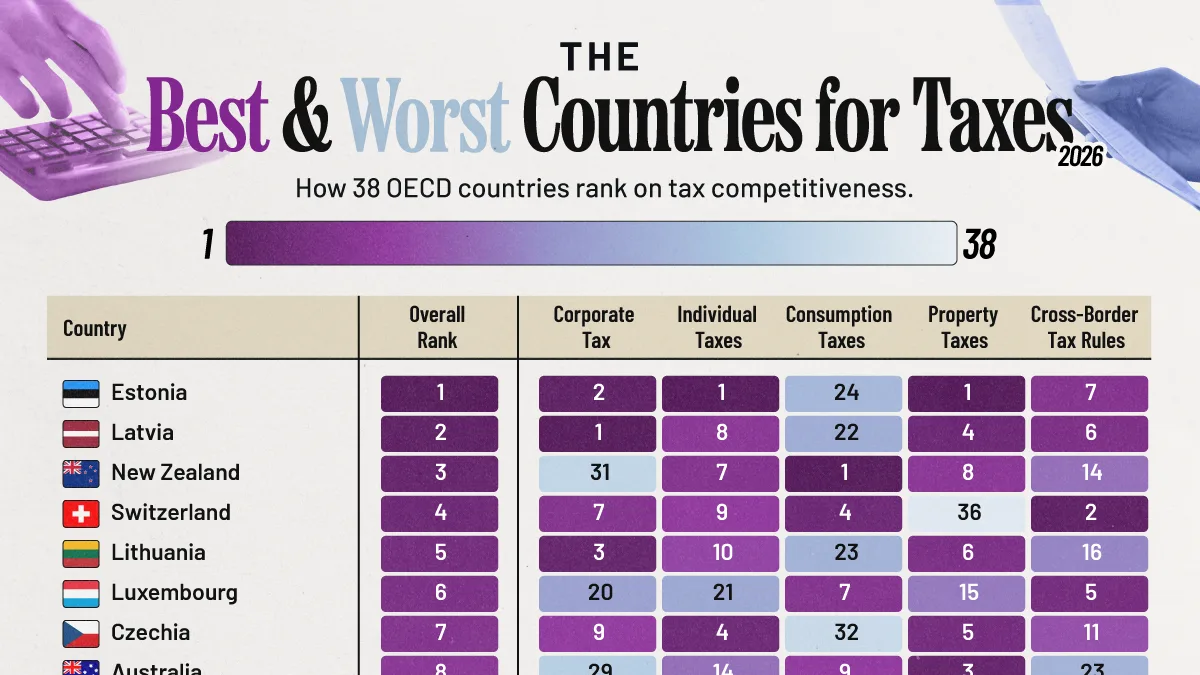
How 38 Countries Compare on Tax Competitiveness
Key Takeaways:
- Estonia leads all 38 OECD countries in tax competitiveness, followed by Latvia and New Zealand.
- The U.S. ranks 17th overall, placing eighth for corporate taxes but 37th for cross-border tax rules.
- France ranks last, with Colombia and Italy rounding out the bottom three.
Tax systems can shape investment, business decisions, and economic activity. Some countries favor simpler rules and investment incentives, while others have more complex tax structures.
The Tax Foundation’s 2026 International Tax Competitiveness Index evaluates 38 OECD countries using more than 40 policy variables across five categories: corporate, individual, consumption, property, and cross-border taxes.
The index focuses on tax competitiveness and neutrality, rather than the overall amount of taxes collected.
Which Countries Have the Most Competitive Tax Systems?
The following table ranks all 38 OECD countries using the Tax Foundation’s 2026 index.
| Overall Rank |
Country | Overall Score |
Corporate Rank |
Individual Rank |
Consumption Rank |
Property Rank |
Cross-Border Rank |
|---|---|---|---|---|---|---|---|
| 1 |  Estonia |
100.0 | 2 | 1 | 24 | 1 | 7 |
| 2 |  Latvia |
92.5 | 1 | 8 | 22 | 4 | 6 |
| 3 |  New Zealand |
88.2 | 31 | 7 | 1 | 8 | 14 |
| 4 |  Switzerland |
86.8 | 7 | 9 | 4 | 36 | 2 |
| 5 |  Lithuania |
82.6 | 3 | 10 | 23 | 6 | 16 |
| 6 |  Luxembourg |
81.9 | 20 | 21 | 7 | 15 | 5 |
| 7 |  Czech Republic |
79.4 | 9 | 4 | 32 | 5 | 11 |
| 8 |  Australia |
78.9 | 29 | 14 | 9 | 3 | 23 |
| 9 |  Turkey |
76.0 | 21 | 6 | 15 | 22 | 8 |
| 10 |  Hungary |
75.6 | 5 | 3 | 38 | 23 | 4 |
| 11 |  Israel |
75.1 | 11 | 31 | 11 | 10 | 18 |
| 12 |  Slovak Republic |
74.7 | 24 | 2 | 33 | 7 | 17 |
| 13 |  Sweden |
74.6 | 6 | 18 | 26 | 9 | 12 |
| 14 |  Costa Rica |
73.3 | 35 | 13 | 6 | 11 | 29 |
| 15 |  Canada |
72.2 | 17 | 28 | 8 | 25 | 28 |
| 16 |  Netherlands |
71.6 | 23 | 30 | 14 | 20 | 3 |
| 17 |  United States |
71.2 | 8 | 17 | 3 | 27 | 37 |
| 18 |  Austria |
70.9 | 18 | 27 | 17 | 17 | 10 |
| 19 |  Germany |
69.2 | 30 | 34 | 13 | 12 | 9 |
| 20 |  Norway |
67.5 | 15 | 29 | 27 | 16 | 15 |
| 21 |  Mexico |
66.9 | 28 | 26 | 12 | 2 | 38 |
| 22 |  Finland |
66.2 | 10 | 24 | 28 | 21 | 24 |
| 23 |  Greece |
65.9 | 22 | 5 | 29 | 30 | 19 |
| 24 |  Chile |
65.2 | 32 | 23 | 10 | 13 | 36 |
| 25 |  Slovenia |
64.5 | 14 | 12 | 30 | 24 | 30 |
| 26 |  Korea |
63.8 | 26 | 38 | 2 | 31 | 34 |
| 27 |  Belgium |
63.5 | 16 | 15 | 25 | 28 | 21 |
| 28 |  Japan |
62.3 | 36 | 35 | 5 | 26 | 31 |
| 29 |  Ireland |
62.2 | 4 | 36 | 35 | 18 | 27 |
| 30 |  United Kingdom |
61.9 | 25 | 22 | 34 | 33 | 1 |
| 31 |  Denmark |
61.6 | 19 | 37 | 20 | 14 | 32 |
| 32 |  Poland |
61.2 | 12 | 11 | 36 | 29 | 25 |
| 33 |  Portugal |
59.6 | 34 | 19 | 21 | 19 | 33 |
| 34 |  Iceland |
59.0 | 13 | 32 | 19 | 34 | 26 |
| 35 |  Spain |
57.5 | 33 | 20 | 18 | 35 | 20 |
| 36 |  Italy |
50.8 | 27 | 16 | 37 | 38 | 22 |
| 37 |  Colombia |
47.3 | 37 | 25 | 16 | 37 | 35 |
| 38 |  France |
45.7 | 38 | 33 | 31 | 32 | 13 |
Three Baltic countries rank among the top five: Estonia, Latvia, and Lithuania. All three perform particularly well in corporate and property tax competitiveness.
The top 10 also includes New Zealand, Switzerland, Luxembourg, Czechia, Australia, Turkey, and Hungary, reflecting a wide range of approaches to taxation.
Why Tax Competitiveness Varies by Country
Estonia’s system stands out for taxing corporate profits primarily when they are distributed rather than when they are earned, encouraging reinvestment.
Countries can perform very differently across individual tax categories. New Zealand ranks first for consumption taxes but 31st for corporate taxes, while the UK ranks first for cross-border tax rules but just 30th overall.
The U.S. presents another contrast, ranking eighth for corporate taxes but 37th for cross-border rules. Beyond federal tax policy, its lifetime tax burden also varies considerably across states.
Tax Competitiveness vs. Tax Burden
Tax competitiveness and overall tax burden measure different aspects of a country’s tax system. The former focuses on the structure of tax rules and their effects on economic decisions, while the latter concerns how much tax is paid.
This distinction is particularly relevant in Europe, where some countries combine competitive tax systems with substantial tax revenues that fund public services.
For another perspective, compare these rankings with tax revenue as a share of GDP, which measures how much governments collect relative to the size of their economies.
Learn More on the Voronoi App
Explore Visualized: How Family Incomes Compare to Taxes in Europe to see how taxes affect household incomes across European countries.