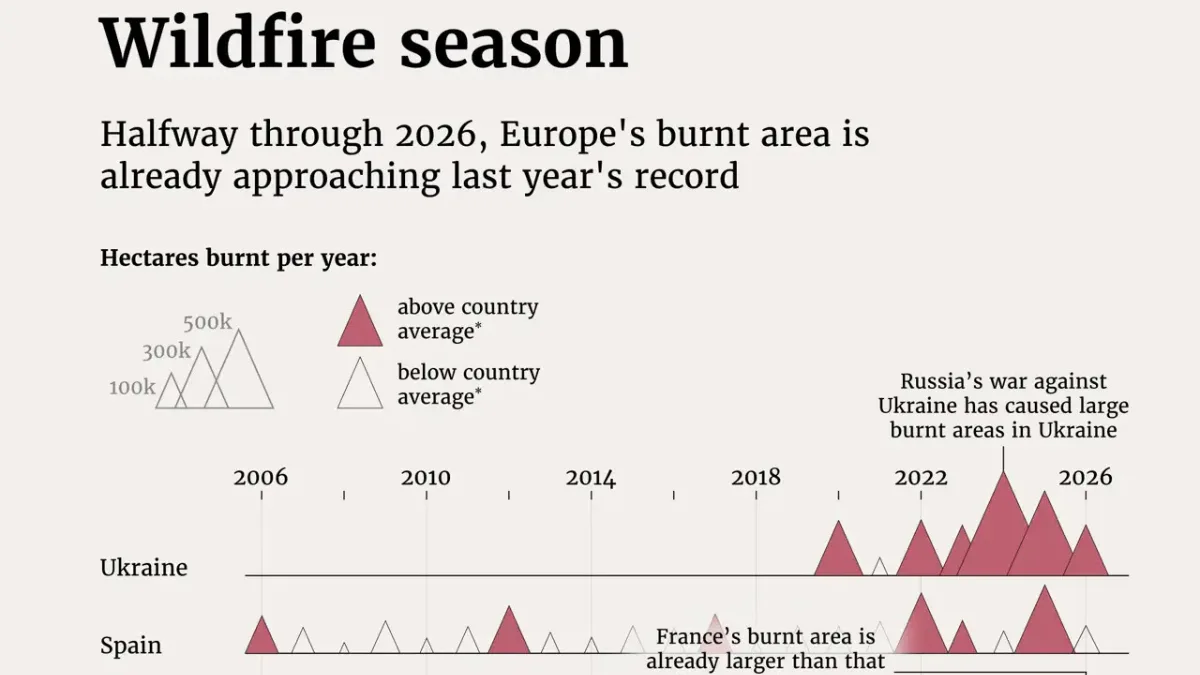
Charted: Europe’s Burned Area Nears Last Year’s Record
See visuals like this from many other data creators on our Voronoi app. Download it for free on iOS or Android and discover incredible data-driven charts from a variety of trusted sources.
Key Takeaways:
- Europe’s burned area in 2026 is already approaching the total recorded in 2025.
- Germany, Cyprus, Romania, and France are among the countries furthest above their historical averages.
- Ukraine’s recent totals also reflect fires linked to Russia’s war.
Europe has already recorded a severe start to the 2026 wildfire season.
The graphic above , created by The European Correspondent using data from the European Forest Fire Information System (EFFIS), tracks annual burned area across European countries since 2006.
Where Burned Area Is Highest
Spain and Portugal have recorded some of Europe’s largest cumulative burned areas over the past two decades. Italy, Greece, Türkiye, and several Balkan countries have also experienced major fire years.
The table below compares each country’s latest burned area with its long-term annual average.
| Country | Annual Avg. Burned Area (ha) | 2025 Burned Area (ha) | % vs. Avg. | Status vs. avg |
|---|---|---|---|---|
 Austria Austria |
89 | 431 | +384.0% | Above |
 Belgium Belgium |
213 | 668 | +213.5% | Above |
 Bulgaria Bulgaria |
12,311 | 32,752 | +166.0% | Above |
 Croatia Croatia |
13,765 | 3,380 | -75.4% | Below |
 Cyprus Cyprus |
1,815 | 13,527 | +645.4% | Above |
 Czech Republic Czech Republic |
83 | 0 | -100.0% | Below |
 Denmark Denmark |
73 | 255 | +251.3% | Above |
 Estonia Estonia |
29 | 0 | -100.0% | Below |
 Finland Finland |
187 | 407 | +117.2% | Above |
 France France |
13,588 | 36,951 | +171.9% | Above |
 Germany Germany |
672 | 5,475 | +714.9% | Above |
 Greece Greece |
50,318 | 47,819 | -5.0% | Below |
 Hungary Hungary |
737 | 666 | -9.6% | Below |
 Ireland Ireland |
3,139 | 4,355 | +38.7% | Above |
 Italy Italy |
55,799 | 84,348 | +51.2% | Above |
 Latvia Latvia |
168 | 30 | -82.1% | Below |
 Lithuania Lithuania |
31 | 0 | -100.0% | Below |
 Luxembourg Luxembourg |
0 | 0 | N/A | N/A |
 Malta Malta |
3 | 0 | -100.0% | Below |
 Netherlands Netherlands |
98 | 170 | +74.2% | Above |
 Poland Poland |
368 | 295 | -19.7% | Below |
 Portugal Portugal |
96,360 | 278,917 | +189.5% | Above |
 Romania Romania |
22,889 | 129,443 | +465.5% | Above |
 Slovakia Slovakia |
27 | 362 | +1,230.4% | Above |
 Slovenia Slovenia |
328 | 143 | -56.4% | Below |
 Spain Spain |
79,570 | 393,079 | +394.0% | Above |
 Sweden Sweden |
2,182 | 1,079 | -50.5% | Below |
Total area and percentage change tell different stories. Mediterranean countries tend to rank highly by hectares burned, while countries with smaller historical baselines can post much larger percentage increases.
Major Fires Hit France and Spain
France battled large fires near Bordeaux that forced tens of thousands of residents and tourists to evacuate. Spain also introduced emergency measures as fires spread during successive heatwaves.
France requested assistance through the European Union’s shared firefighting resources, and its burned area had surpassed the previous year’s total by mid-July.
The chart also shows unusually large burned areas in Ukraine since 2022, where military activity has added another source of fire damage.
Why Wildfire Conditions Are Worsening
Hotter temperatures, prolonged drought, changing land use, and fuel accumulation can all make fires easier to ignite and harder to contain.
Analysis from Reuters and the European Commission’s Joint Research Centre notes that earlier heatwaves are lengthening the fire season across parts of southern Europe.
The financial impact can also be substantial. Wildfires are part of a broader rise in costly climate-driven natural disasters, while the world’s most expensive wildfire disasters show how quickly property, suppression, and recovery costs can escalate.
Learn More on the Voronoi App 
To learn more about the global impact of wildfires, check out How Much CO2 Do Wildfires Contribute Globally? on the Voronoi app.