Charted: The World’s Shift to Cities (1950–2050)
See visuals like this from many other data creators on our Voronoi app. Download it for free on iOS or Android and discover incredible data-driven charts from a variety of trusted sources.
Key Takeaways
- Just 20% of the world’s total population lived in cities in 1950, a share projected to increase to 48% by 2050.
- Cities overtook the global rural population in 1975 and the global town population in 1997.
- The world’s rural population is expected to peak at 1.65 billion in 2046 before gradually declining.
The world has become steadily more urbanized over the last century, reshaping where people live, work, and build communities.
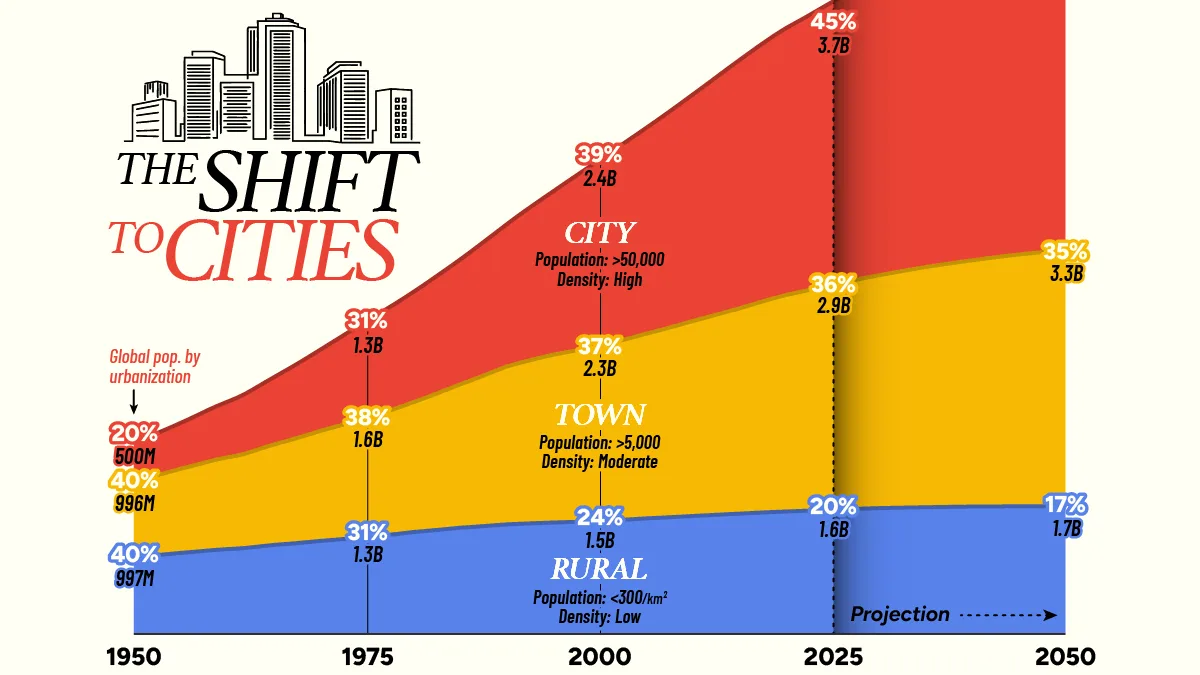
This visualization tracks the global population by degree of urbanization from 1950 to 2050, showing the shift between cities, towns, and rural areas. The data comes from the United Nations Department of Economic and Social Affairs, Population Division.
In this dataset, cities are defined as areas with at least 50,000 people and high population density. Towns have at least 5,000 people and moderate density, while rural areas have fewer than 300 inhabitants per square kilometer. The figures from 2025 to 2050 are projections.
A Global Shift Toward City Living
In 1950, city living was relatively uncommon, with just 500 million people, or about 20% of the global population, living in cities.
At that time, both towns and rural areas made up much more of the global total, with each home to nearly one billion people, or roughly 40% of the world’s population.
| Year | World City Population Share |
World Town Population Share |
World Rural Population Share |
|---|---|---|---|
| 1950 | 20% | 40% | 40% |
| 1975 | 31% | 38% | 31% |
| 2000 | 39% | 37% | 24% |
| 2025 | 45% | 36% | 20% |
| 2050P | 48% | 35% | 17% |
That balance changed quickly. Cities overtook rural areas in 1975, when the global city population reached 1.27 billion compared with 1.25 billion in rural areas.
By 1997, cities had also surpassed towns and have remained the world’s largest population category ever since, growing faster than both towns and rural areas in absolute and relative terms.
As of 2025, an estimated 3.69 billion people live in cities, representing roughly 45% of the global population. Cities are now the most prevalent settlement type in 104 countries.
Rural Populations Are Expected to Peak Mid-Century
Although the world’s rural population growth has not kept pace with growth in cities and towns, the rural population has continued to rise, from 997 million in 1950 to an estimated 1.61 billion in 2025. However, as a share of the world total, rural areas fell from 40% in 1950 to 20% in 2025 and are projected to decline to 17% by 2050.
Sub-Saharan Africa is the only region where rural populations have substantially increased over the past 75 years. All other regions have mainly experienced growth in cities and towns. As a result, the global rural population is projected to peak at 1.65 billion in 2046, making it the first of the three settlement categories expected to begin declining in absolute terms.
After that point, rural population totals are projected to edge lower, even as the overall global population continues to rise.
Nearly Half the World Could Live in Cities by 2050
By 2050, the world’s city population is projected to reach 4.67 billion people, more than nine times the city population recorded in 1950. This unprecedented degree of urbanization reflects several converging factors, including a reduced need for rural farm labor due to agricultural mechanization, alongside greater access to jobs, education, goods, services, and entertainment in cities.
City dwellers are expected to account for two-thirds of projected global population growth by 2050, with most of the remaining growth concentrated in towns. By then, cities are expected to be the main settlement type in 127 countries worldwide.
The full year-by-year dataset is available below. By 2050, the global town and rural populations are projected to reach 3.34 billion and 1.65 billion, respectively, compared with 4.67 billion people living in cities.
| Year | World City Population (millions) |
World Town Population (millions) |
World Rural Population (millions) |
|---|---|---|---|
| 1950 | 500.3 | 995.8 | 997.0 |
| 1951 | 518.6 | 1,013.4 | 1,004.9 |
| 1952 | 537.4 | 1,032.5 | 1,014.1 |
| 1953 | 556.8 | 1,052.9 | 1,024.4 |
| 1954 | 576.6 | 1,073.9 | 1,035.4 |
| 1955 | 596.9 | 1,096.0 | 1,047.3 |
| 1956 | 622.1 | 1,116.3 | 1,057.0 |
| 1957 | 647.7 | 1,137.5 | 1,067.4 |
| 1958 | 673.6 | 1,159.2 | 1,078.4 |
| 1959 | 699.1 | 1,178.6 | 1,088.3 |
| 1960 | 723.6 | 1,195.2 | 1,096.6 |
| 1961 | 751.4 | 1,210.6 | 1,102.8 |
| 1962 | 780.6 | 1,230.8 | 1,112.0 |
| 1963 | 811.6 | 1,256.4 | 1,124.7 |
| 1964 | 843.7 | 1,282.8 | 1,138.0 |
| 1965 | 875.6 | 1,308.3 | 1,150.7 |
| 1966 | 911.6 | 1,332.2 | 1,160.2 |
| 1967 | 947.1 | 1,356.3 | 1,170.0 |
| 1968 | 983.3 | 1,381.3 | 1,180.7 |
| 1969 | 1,020.5 | 1,407.2 | 1,191.9 |
| 1970 | 1,057.9 | 1,433.3 | 1,203.4 |
| 1971 | 1,099.8 | 1,457.0 | 1,213.1 |
| 1972 | 1,141.7 | 1,480.4 | 1,222.8 |
| 1973 | 1,183.7 | 1,504.2 | 1,232.9 |
| 1974 | 1,225.7 | 1,527.7 | 1,243.0 |
| 1975 | 1,267.4 | 1,550.4 | 1,253.0 |
| 1976 | 1,300.6 | 1,578.2 | 1,265.5 |
| 1977 | 1,333.8 | 1,605.9 | 1,278.2 |
| 1978 | 1,367.2 | 1,633.7 | 1,291.2 |
| 1979 | 1,401.3 | 1,662.3 | 1,305.0 |
| 1980 | 1,436.1 | 1,691.9 | 1,319.6 |
| 1981 | 1,473.5 | 1,725.6 | 1,329.6 |
| 1982 | 1,511.5 | 1,760.6 | 1,340.6 |
| 1983 | 1,549.7 | 1,795.8 | 1,351.9 |
| 1984 | 1,587.9 | 1,831.0 | 1,363.3 |
| 1985 | 1,626.6 | 1,867.1 | 1,375.3 |
| 1986 | 1,671.0 | 1,903.9 | 1,383.1 |
| 1987 | 1,716.2 | 1,941.8 | 1,391.8 |
| 1988 | 1,761.4 | 1,980.0 | 1,400.6 |
| 1989 | 1,806.6 | 2,018.3 | 1,409.6 |
| 1990 | 1,851.5 | 2,057.3 | 1,419.0 |
| 1991 | 1,908.2 | 2,085.8 | 1,424.7 |
| 1992 | 1,963.9 | 2,112.4 | 1,429.7 |
| 1993 | 2,018.8 | 2,138.3 | 1,434.5 |
| 1994 | 2,073.7 | 2,162.9 | 1,439.0 |
| 1995 | 2,128.2 | 2,187.3 | 1,443.4 |
| 1996 | 2,188.5 | 2,206.7 | 1,446.9 |
| 1997 | 2,248.6 | 2,226.0 | 1,450.2 |
| 1998 | 2,308.8 | 2,244.7 | 1,453.6 |
| 1999 | 2,369.0 | 2,263.1 | 1,456.9 |
| 2000 | 2,429.4 | 2,281.7 | 1,460.6 |
| 2001 | 2,480.4 | 2,306.9 | 1,467.7 |
| 2002 | 2,530.9 | 2,331.9 | 1,475.0 |
| 2003 | 2,581.3 | 2,356.8 | 1,482.3 |
| 2004 | 2,631.9 | 2,381.7 | 1,489.8 |
| 2005 | 2,682.7 | 2,406.7 | 1,497.6 |
| 2006 | 2,735.8 | 2,432.6 | 1,503.1 |
| 2007 | 2,789.5 | 2,458.9 | 1,509.0 |
| 2008 | 2,843.6 | 2,485.6 | 1,515.3 |
| 2009 | 2,898.2 | 2,512.7 | 1,521.9 |
| 2010 | 2,952.8 | 2,540.2 | 1,528.8 |
| 2011 | 3,009.2 | 2,567.1 | 1,534.7 |
| 2012 | 3,066.1 | 2,594.4 | 1,540.8 |
| 2013 | 3,123.3 | 2,621.6 | 1,546.9 |
| 2014 | 3,180.4 | 2,648.3 | 1,552.9 |
| 2015 | 3,237.0 | 2,674.4 | 1,559.0 |
| 2016 | 3,288.1 | 2,705.3 | 1,565.2 |
| 2017 | 3,338.3 | 2,736.0 | 1,571.4 |
| 2018 | 3,387.0 | 2,765.7 | 1,577.2 |
| 2019 | 3,434.2 | 2,794.4 | 1,582.7 |
| 2020 | 3,478.6 | 2,821.2 | 1,587.2 |
| 2021 | 3,519.2 | 2,843.5 | 1,591.7 |
| 2022 | 3,559.9 | 2,865.4 | 1,596.2 |
| 2023 | 3,602.1 | 2,888.3 | 1,601.4 |
| 2024 | 3,644.2 | 2,911.2 | 1,606.6 |
| 2025 | 3,686.0 | 2,933.9 | 1,611.7 |
| 2026 | 3,730.1 | 2,954.8 | 1,615.8 |
| 2027 | 3,773.8 | 2,975.5 | 1,619.8 |
| 2028 | 3,817.0 | 2,995.9 | 1,623.7 |
| 2029 | 3,859.8 | 3,016.0 | 1,627.5 |
| 2030 | 3,902.1 | 3,035.8 | 1,631.2 |
| 2031 | 3,944.9 | 3,055.5 | 1,633.7 |
| 2032 | 3,987.3 | 3,074.9 | 1,636.0 |
| 2033 | 4,029.3 | 3,093.9 | 1,638.2 |
| 2034 | 4,070.8 | 3,112.6 | 1,640.3 |
| 2035 | 4,111.9 | 3,130.9 | 1,642.3 |
| 2036 | 4,153.7 | 3,147.5 | 1,644.5 |
| 2037 | 4,195.0 | 3,163.7 | 1,646.4 |
| 2038 | 4,235.9 | 3,179.5 | 1,648.2 |
| 2039 | 4,276.2 | 3,194.8 | 1,649.9 |
| 2040 | 4,316.0 | 3,209.8 | 1,651.4 |
| 2041 | 4,354.6 | 3,225.4 | 1,652.3 |
| 2042 | 4,392.5 | 3,240.5 | 1,653.1 |
| 2043 | 4,429.9 | 3,255.1 | 1,653.7 |
| 2044 | 4,466.6 | 3,269.2 | 1,654.1 |
| 2045 | 4,502.6 | 3,282.8 | 1,654.2 |
| 2046 | 4,538.1 | 3,295.5 | 1,654.3 |
| 2047 | 4,572.9 | 3,307.5 | 1,654.2 |
| 2048 | 4,606.8 | 3,319.0 | 1,653.7 |
| 2049 | 4,640.0 | 3,329.8 | 1,653.1 |
| 2050 | 4,672.2 | 3,340.0 | 1,652.1 |
Together, cities and towns are projected to account for more than 80% of the global population by 2050. This marks one of the defining demographic shifts of the modern era, as a world that was once largely rural becomes increasingly urban.
Learn More on the Voronoi App 
If you enjoyed today’s post, check out How Urbanization Has Reshaped Asia Over the Last 50 Years on Voronoi, the new app from Visual Capitalist.