How Global Government Debt Grew to $111 Trillion
See visuals like this from many other data creators on our Voronoi app. Download it for free on iOS or Android and discover incredible data-driven charts from a variety of trusted sources.
Key Takeaways
- Global government debt rose from $19.7T in 2000 to $111T in 2025.
- The sharpest increases followed the 2008 financial crisis and 2020 pandemic.
- The U.S. and China drove a growing share of the total over time.
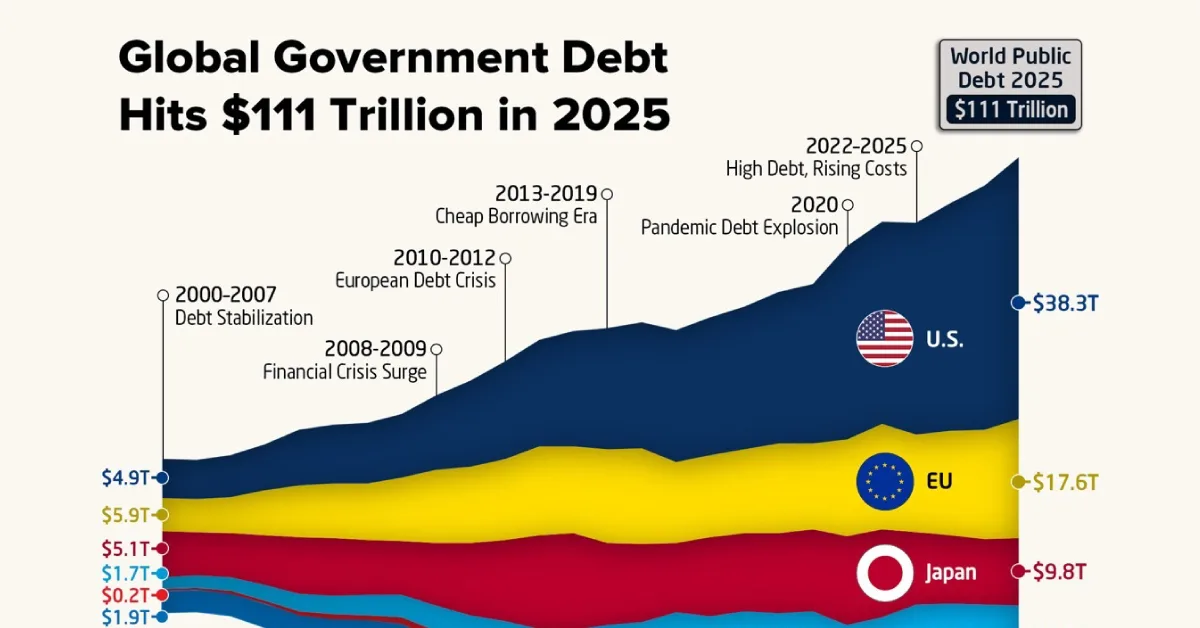
Global government debt has crossed a new milestone. Gross public debt worldwide reached $111 trillion in 2025, more than five times the $19.7 trillion recorded in 2000.
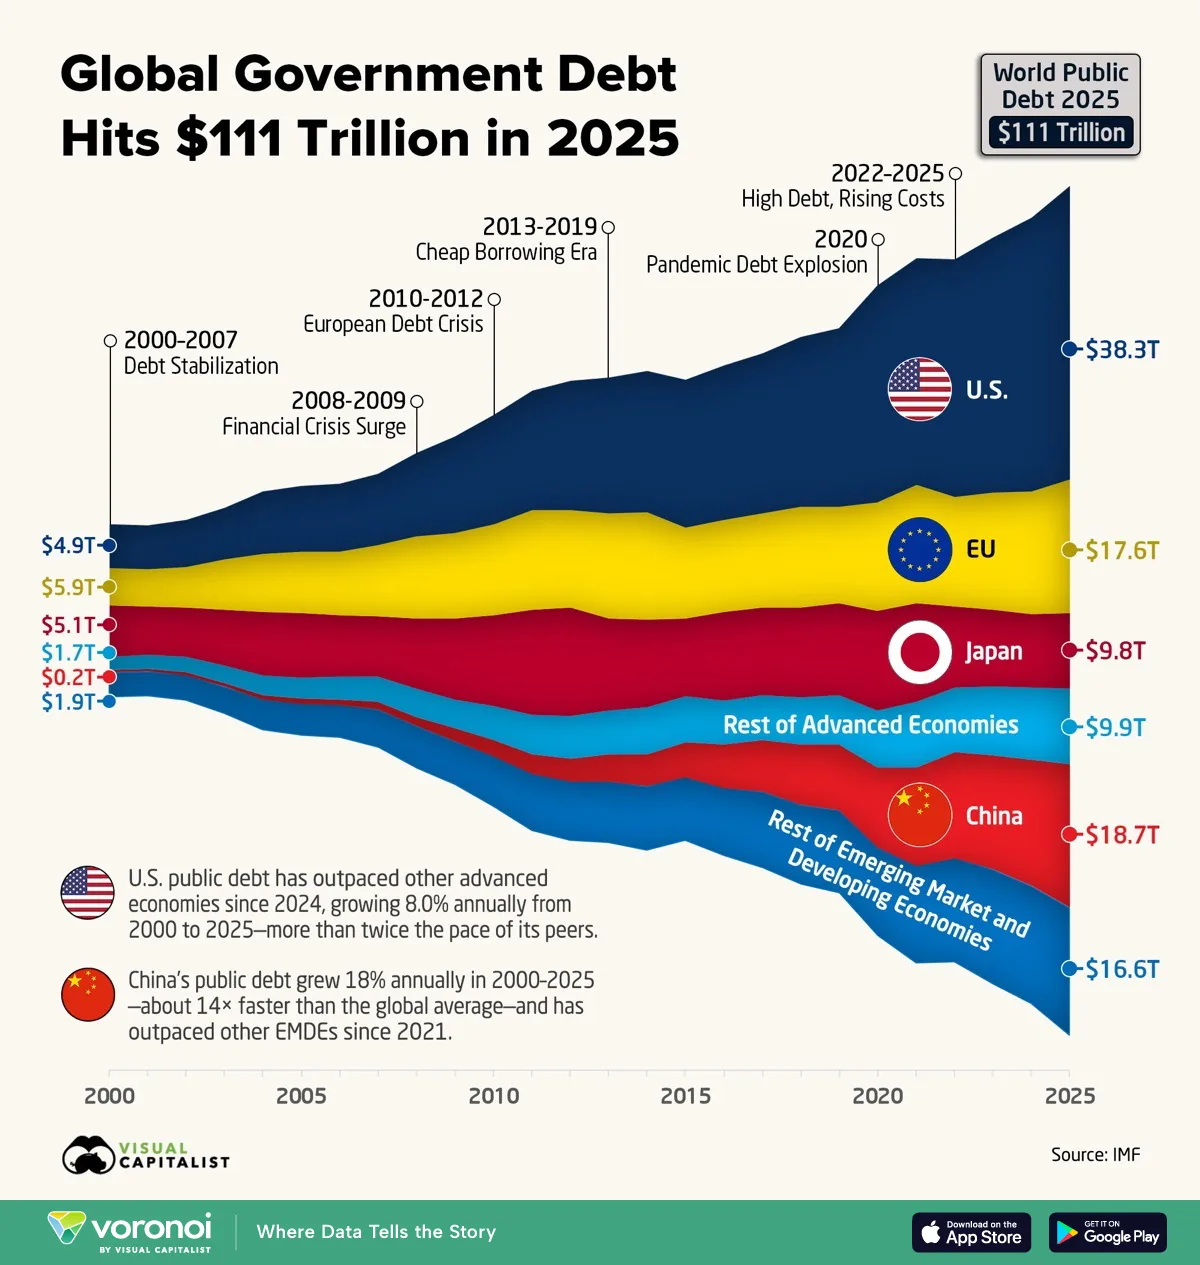
This visualization uses data from the IMF to trace that trajectory through a stacked area chart, breaking down world public debt by the U.S., the EU, Japan, China, the rest of advanced economies, and emerging market and developing economies from 2000 to 2025.
The U.S. and China Now Hold Over Half of All Government Debt
Two countries dominate the picture. The United States carries $38.3 trillion in public debt, while China holds $18.7 trillion. Combined, they account for roughly 51% of the global total.
The data table below shows the government debt from 2000 to 2025 in U.S. dollars for the U.S., China, the EU, Japan, and rest of the world:
| Year |  U.S. Gov’t Debt ($T) U.S. Gov’t Debt ($T) |
 EU Gov’t Debt ($T) EU Gov’t Debt ($T) |
 Japan Gov’t Debt ($T) Japan Gov’t Debt ($T) |
 China Gov’t Debt ($T) China Gov’t Debt ($T) |
Other Countries’ Gov’t Debt ($T) |  World Total Gov’t Debt ($T) World Total Gov’t Debt ($T) |
|---|---|---|---|---|---|---|
| 2000 | $4.90 | $5.90 | $5.10 | $0.20 | $3.60 | $19.70 |
| 2001 | $5.66 | $4.86 | $6.35 | $0.33 | $5.02 | $22.21 |
| 2002 | $6.11 | $5.31 | $6.45 | $0.38 | $5.28 | $23.52 |
| 2003 | $6.75 | $6.65 | $7.23 | $0.44 | $5.83 | $26.91 |
| 2004 | $8.12 | $7.66 | $8.29 | $0.52 | $6.49 | $31.07 |
| 2005 | $8.58 | $8.03 | $8.44 | $0.60 | $6.94 | $32.58 |
| 2006 | $8.92 | $8.28 | $8.01 | $0.70 | $7.33 | $33.24 |
| 2007 | $9.40 | $9.21 | $7.92 | $1.04 | $8.25 | $35.81 |
| 2008 | $10.91 | $10.73 | $9.24 | $1.24 | $9.12 | $41.23 |
| 2009 | $12.61 | $11.21 | $10.52 | $1.76 | $9.38 | $45.47 |
| 2010 | $14.39 | $11.80 | $11.86 | $2.05 | $11.09 | $51.19 |
| 2011 | $15.60 | $13.10 | $13.66 | $2.53 | $12.65 | $57.53 |
| 2012 | $16.85 | $12.77 | $14.18 | $2.94 | $13.21 | $59.94 |
| 2013 | $17.73 | $13.68 | $11.96 | $3.57 | $13.80 | $60.73 |
| 2014 | $18.48 | $14.05 | $11.42 | $4.21 | $14.46 | $62.61 |
| 2015 | $19.29 | $11.88 | $10.15 | $4.61 | $14.21 | $60.13 |
| 2016 | $20.19 | $12.02 | $11.63 | $5.69 | $14.60 | $64.14 |
| 2017 | $20.86 | $12.39 | $11.41 | $6.74 | $15.83 | $67.23 |
| 2018 | $22.23 | $13.09 | $11.71 | $7.84 | $16.60 | $71.48 |
| 2019 | $23.43 | $12.51 | $12.10 | $8.66 | $17.16 | $73.85 |
| 2020 | $28.33 | $14.15 | $13.06 | $10.43 | $18.97 | $84.92 |
| 2021 | $29.66 | $15.48 | $12.78 | $12.76 | $21.39 | $92.07 |
| 2022 | $31.03 | $14.30 | $10.58 | $13.81 | $22.06 | $91.78 |
| 2023 | $33.33 | $15.27 | $10.11 | $14.98 | $23.77 | $97.46 |
| 2024 | $35.84 | $16.04 | $9.49 | $16.56 | $24.74 | $102.67 |
| 2025 | $38.29 | $17.55 | $9.83 | $18.67 | $26.60 | $110.93 |
The U.S. trajectory accelerated sharply in 2020, when pandemic-era spending pushed federal debt from $23.4 trillion to $28.3 trillion in a single year. It has continued climbing since, driven by elevated deficits, rising interest costs, and no meaningful fiscal consolidation.
China’s path has been different in character but equally striking in scale. Starting from just $0.2 trillion in 2000, Chinese public debt grew at approximately 18% per year, roughly 14 times the global average in dollar terms. Much of this reflects local government borrowing to fund infrastructure and property development.
How the Global Debt Landscape Has Shifted Since 2000
The chart highlights several distinct phases in the buildup of global debt:
2000–2007: Debt Stabilization. Total public debt grew modestly from $19.7 trillion to $35.8 trillion, largely in line with global GDP growth.
2008–2009: Financial Crisis Surge. The global financial crisis triggered a sharp jump in sovereign borrowing as governments bailed out banks and launched stimulus programs. Global debt rose from $35.8 trillion to $45.5 trillion in two years.
2010–2012: European Debt Crisis. EU sovereign debt reached $13.1 trillion in 2011 as Greece, Italy, and Spain faced spiraling borrowing costs. Austerity measures followed across the eurozone.
2013–2019: Cheap Borrowing Era. Low interest rates allowed governments to sustain higher debt loads without immediate fiscal pressure. Global debt drifted from $60.7 trillion to $73.9 trillion.
2020: Pandemic Debt Explosion. COVID-19 pushed global debt from $73.9 trillion to $84.9 trillion in a single year, the largest one-year increase on record.
2022–2025: High Debt, Rising Costs. With interest rates elevated, the cost of servicing this debt has risen sharply, particularly for the U.S. and emerging economies.
Japan and the EU: Diverging Paths
Japan’s debt peaked at $14.2 trillion in 2012 and has since declined to $9.8 trillion, partly due to yen depreciation against the dollar (debt is denominated in yen but measured here in USD). In domestic terms, Japan’s debt-to-GDP ratio remains among the highest in the world at over 230%.
The EU followed a similar pattern of post-crisis consolidation, with debt falling from a peak of $15.5 trillion in 2021 to $14.3 trillion in 2022 before climbing again to $17.6 trillion in 2025 as member states increased defense and energy spending.
Learn More on the Voronoi App 
If you enjoyed today’s post, check out The World’s $111 Trillion in Government Debt on Voronoi.