How America’s Oil Supply Changed
Key Takeaways
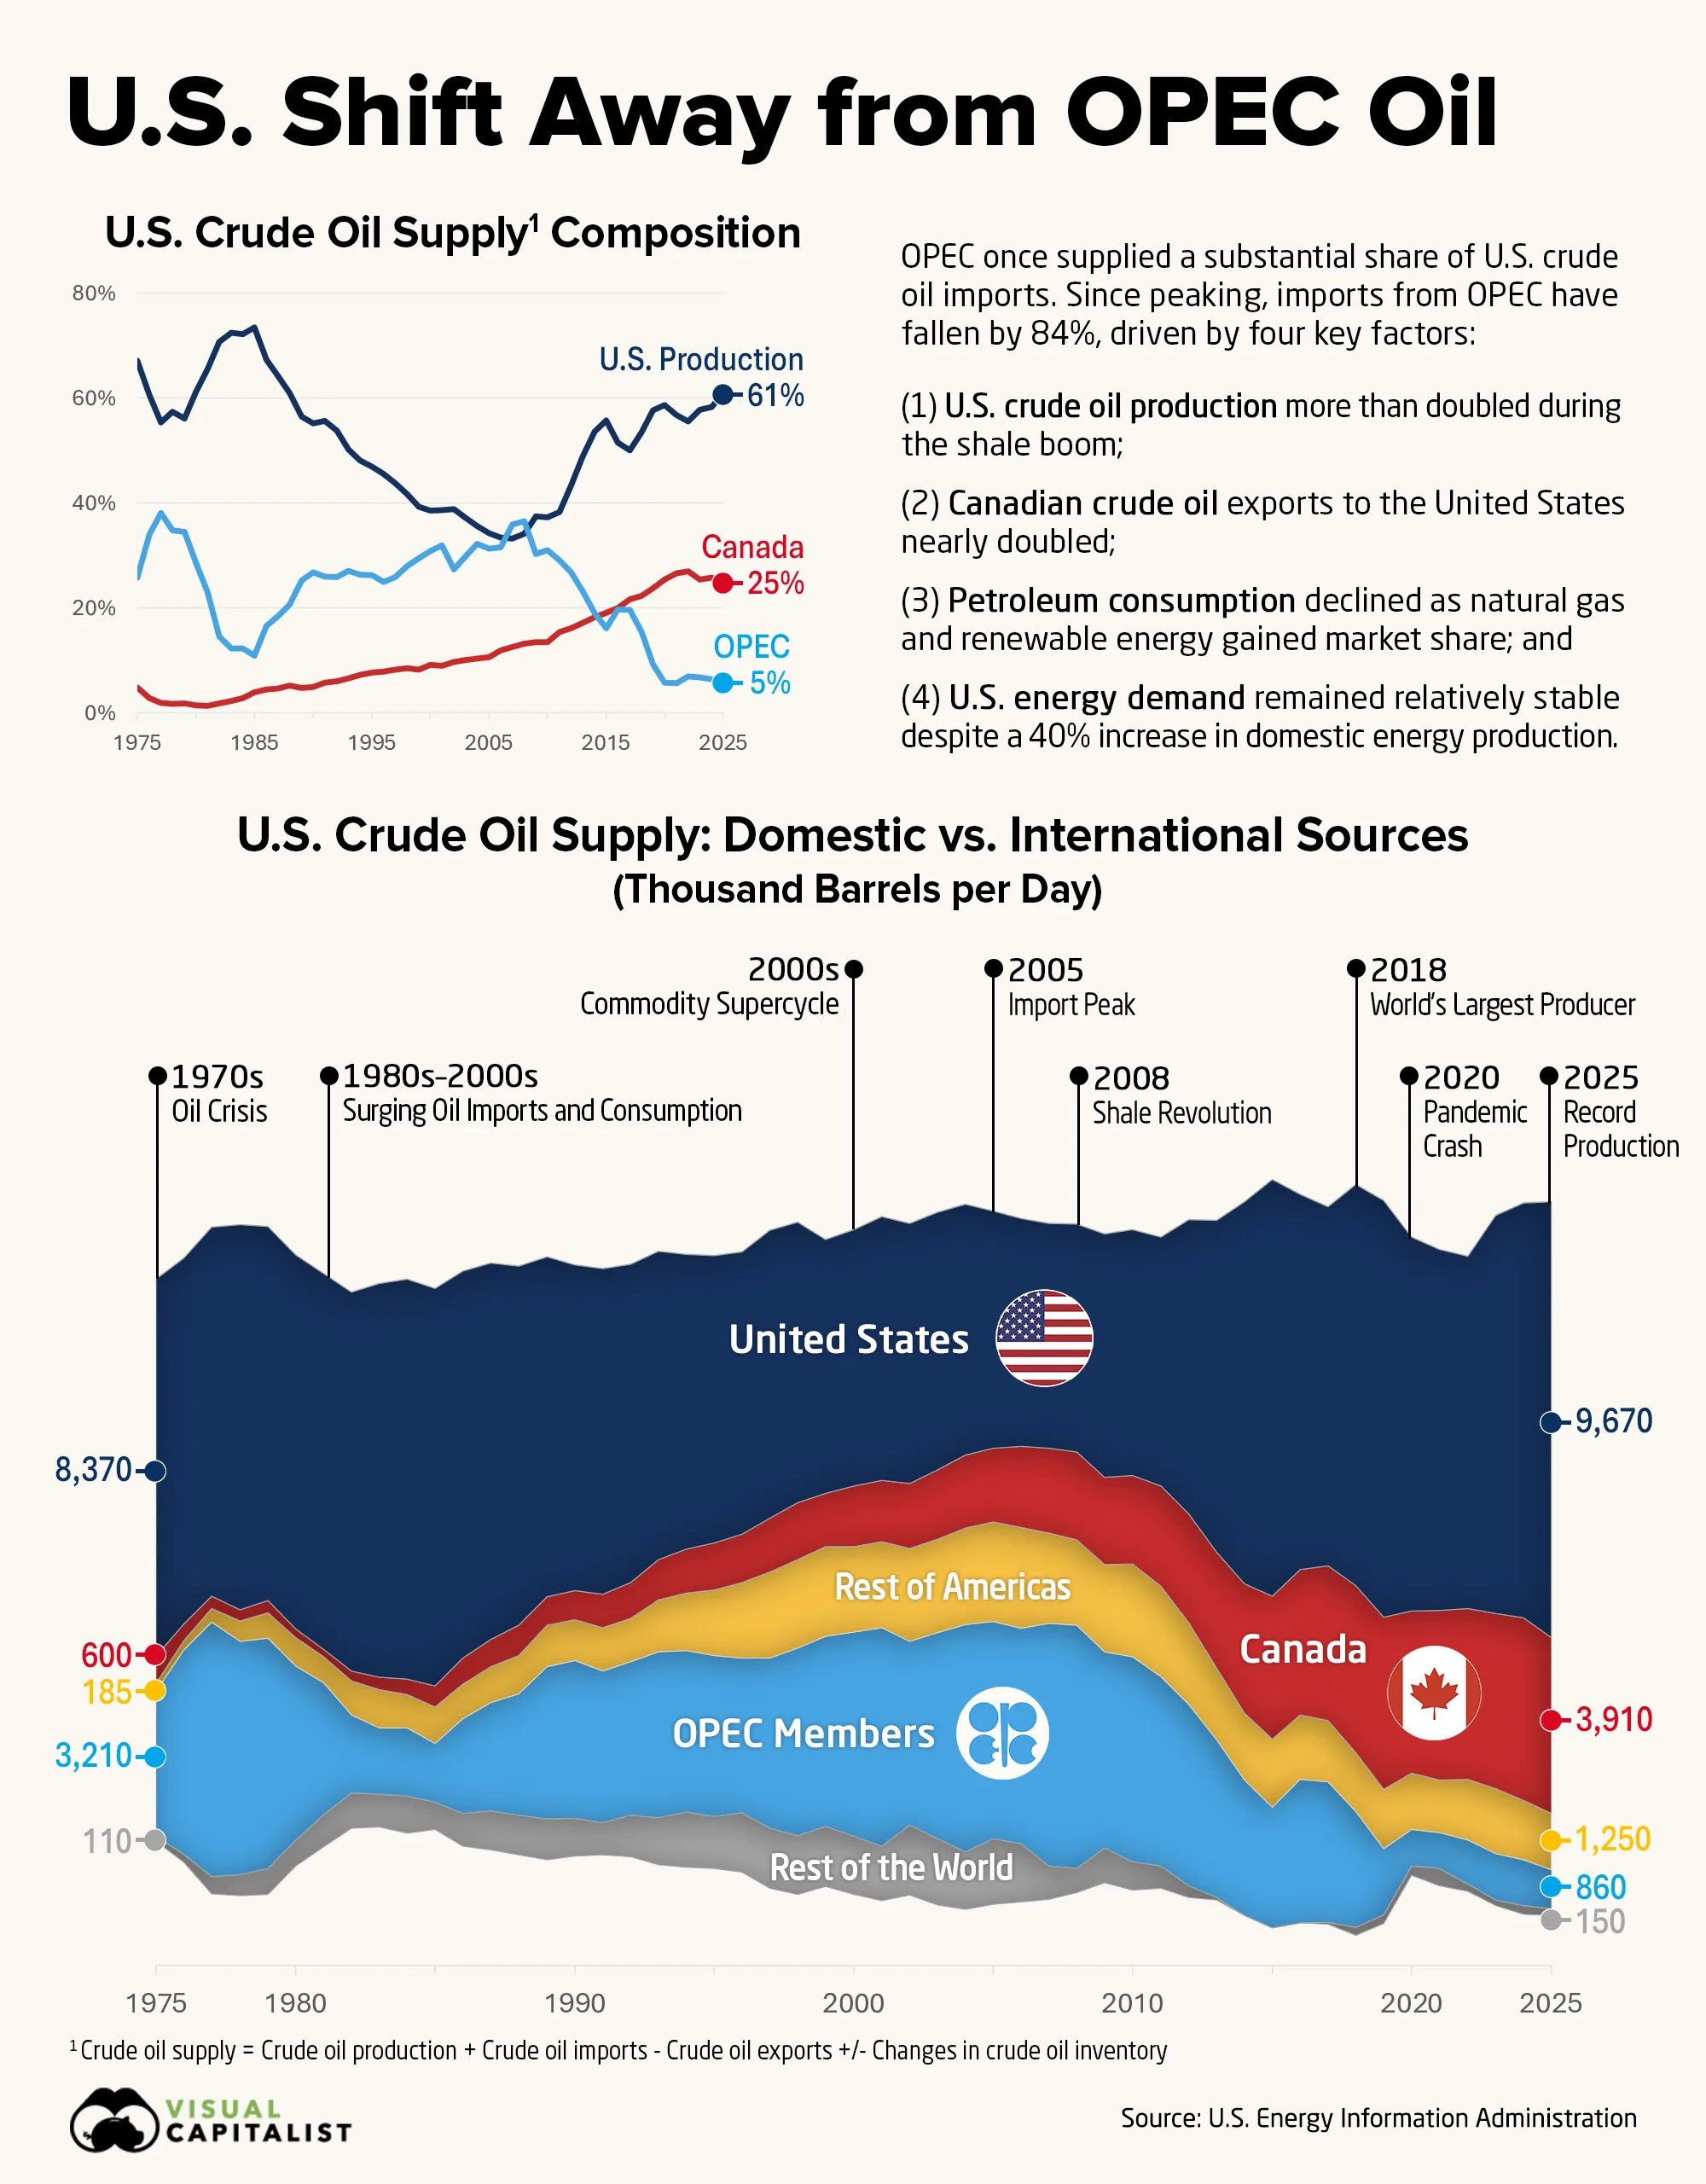
- U.S. crude oil imports from OPEC fell 84%, from 5.42 million barrels per day (bpd) in 2008 to 0.86 million bpd in 2025.
- Canada supplied 3.91 million bpd in 2025, more than 4.5 times the volume imported from OPEC members.
- U.S.-sourced crude oil supply reached 9.67 million bpd in 2025, the highest level in the 51-year series.
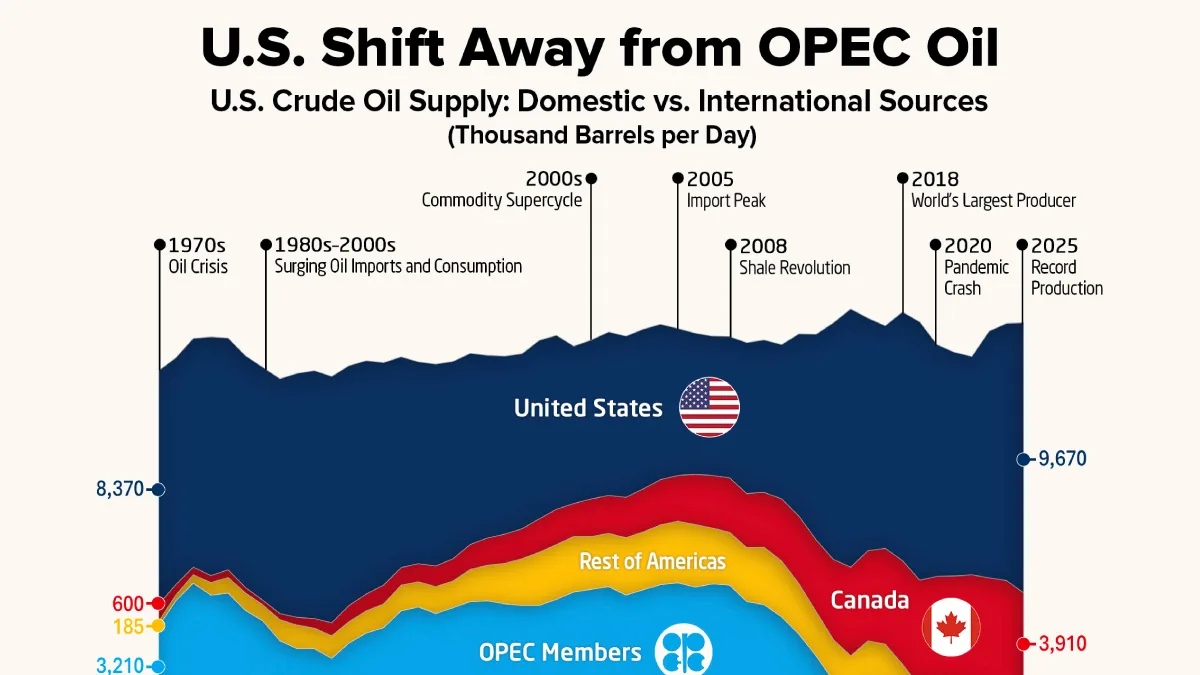
OPEC once dominated U.S. crude imports, while Canada played a much smaller role. Over the past two decades, that relationship has reversed as U.S. domestic supply rebounded and Canada became the country’s largest foreign source of crude oil.
Data for this visualization comes from the U.S. Energy Information Administration’s crude oil supply and disposition series and crude oil imports by origin data. It compares U.S.-sourced crude oil supply with imports from OPEC, Canada, Other Americas, and the rest of the world from 1975 to 2025.
Here, crude oil supply equals domestic production plus imports, minus exports, adjusted for changes in crude inventories. U.S.-sourced crude oil supply is therefore not the same as gross field production.
When America’s Reliance on OPEC Began to Fall
OPEC’s retreat was not a straight line. Its shipments to the U.S. reached a high of 5.64 million bpd in 1977, fell through the early 1980s, then climbed back to 5.42 million bpd by 2008—just as U.S.-sourced supply was near its low.
The decisive break came after 2008. As domestic output began its shale-led rebound, OPEC imports fell sharply. OPEC’s share of the import categories shown dropped from 55% in 2008 to 14% in 2025.
The table below shows how U.S.-sourced crude oil supply and imports by origin changed at 10-year intervals, in thousands of barrels per day:
| Source | U.S. Crude Oil Supply by Year (Thousand Barrels per Day) | |||||
|---|---|---|---|---|---|---|
| 1975 | 1985 | 1995 | 2005 | 2015 | 2025 | |
| U.S.-Sourced Crude Oil Supply | 8,369 | 8,821 | 6,388 | 5,263 | 9,259 | 9,673 |
| OPEC Imports | 3,211 | 1,312 | 3,570 | 4,816 | 2,673 | 860 |
| Canada Imports | 600 | 468 | 1,040 | 1,633 | 3,169 | 3,910 |
| Other Americas Imports | 185 | 813 | 1,465 | 2,217 | 1,515 | 1,251 |
| Rest of World Imports | 109 | 608 | 1,155 | 1,460 | 6 | 148 |
| Total | 12,474 | 12,022 | 13,618 | 15,389 | 16,622 | 15,842 |
The biggest change was where America’s imported crude came from. As OPEC’s role diminished, Canada steadily expanded its share of the U.S. supply mix.
Despite OPEC’s decline, major oil producers such as Saudi Arabia retained a significant oil trading relationship with the United States.
How U.S. Shale and Canadian Oil Filled the Gap
U.S.-sourced crude oil supply reached a low of 4.98 million bpd in 2007. The shale boom then reversed the long decline, lifting supply to 9.67 million bpd by 2025 as domestic production nearly doubled.
Yet rising domestic supply did not eliminate the need for imports. U.S. shale production is generally lighter, while many American refineries are configured for heavier grades. Canada helped fill that mismatch through an integrated pipeline network, with U.S. crude imports from Canada rising from 0.60 million bpd in 1975 to 3.91 million bpd in 2025.
By 2015, Canada was supplying more crude oil to the U.S. than OPEC members combined and has remained the larger supplier ever since.
The table below shows how each source’s share of total U.S. crude oil supply changed at 10-year intervals:
| Source | Share of U.S. Crude Oil Supply by Year (%) | |||||
|---|---|---|---|---|---|---|
| 1975 | 1985 | 1995 | 2005 | 2015 | 2025 | |
| U.S.-Sourced Crude Oil Supply | 67.1 | 73.4 | 46.9 | 34.2 | 55.7 | 61.1 |
| OPEC Imports | 25.7 | 10.9 | 26.2 | 31.3 | 16.1 | 5.4 |
| Canada Imports | 4.8 | 3.9 | 7.6 | 10.6 | 19.1 | 24.7 |
| Other Americas Imports | 1.5 | 6.8 | 10.8 | 14.4 | 9.1 | 7.9 |
| Rest of World Imports | 0.9 | 5.1 | 8.5 | 9.5 | 0.0 | 0.9 |
Figures may not add to 100% exactly due to rounding.
The new mix pairs greater U.S.-sourced supply with growing Canadian imports rather than recreating the country’s earlier reliance on OPEC.
Together, U.S.-sourced supply and Canada accounted for 85.8% of total U.S. crude oil supply in 2025, up from 71.9% in 1975.
America’s Crude Oil Supply Moved Closer to Home
By 2025, the geography of America’s crude supply had shifted decisively toward the Western Hemisphere. Canada and the rest of North and South America supplied a combined 5.16 million bpd, compared with just 1.01 million bpd from OPEC and the rest of the world.
The full dataset below shows each supply stream for every year from 1975 to 2025:
| Year | U.S. Crude Oil Supply (Thousand Barrels per Day) | ||||
|---|---|---|---|---|---|
| U.S.-Sourced Crude Oil Supply | OPEC Imports | Canada Imports | Other Americas Imports | Rest of World Imports | |
| 1975 | 8,369 | 3,211 | 600 | 185 | 109 |
| 1976 | 8,124 | 4,545 | 371 | 197 | 174 |
| 1977 | 8,195 | 5,643 | 279 | 311 | 382 |
| 1978 | 8,549 | 5,184 | 248 | 458 | 466 |
| 1979 | 8,317 | 5,112 | 271 | 560 | 576 |
| 1980 | 8,310 | 3,864 | 199 | 623 | 577 |
| 1981 | 8,344 | 2,922 | 164 | 585 | 725 |
| 1982 | 8,413 | 1,734 | 214 | 756 | 784 |
| 1983 | 8,748 | 1,477 | 274 | 851 | 727 |
| 1984 | 8,879 | 1,512 | 341 | 746 | 827 |
| 1985 | 8,821 | 1,312 | 468 | 813 | 608 |
| 1986 | 8,598 | 2,113 | 570 | 771 | 724 |
| 1987 | 8,367 | 2,400 | 608 | 792 | 874 |
| 1988 | 7,968 | 2,696 | 681 | 851 | 879 |
| 1989 | 7,556 | 3,376 | 630 | 925 | 912 |
| 1990 | 7,239 | 3,514 | 643 | 905 | 832 |
| 1991 | 7,235 | 3,377 | 743 | 954 | 708 |
| 1992 | 7,077 | 3,406 | 797 | 959 | 921 |
| 1993 | 6,845 | 3,687 | 900 | 1,149 | 1,051 |
| 1994 | 6,546 | 3,580 | 983 | 1,275 | 1,225 |
| 1995 | 6,388 | 3,570 | 1,040 | 1,465 | 1,155 |
| 1996 | 6,266 | 3,438 | 1,075 | 1,672 | 1,323 |
| 1997 | 6,388 | 3,775 | 1,198 | 1,917 | 1,335 |
| 1998 | 6,223 | 4,169 | 1,266 | 1,965 | 1,306 |
| 1999 | 5,635 | 4,228 | 1,178 | 1,995 | 1,330 |
| 2000 | 5,694 | 4,544 | 1,348 | 1,892 | 1,287 |
| 2001 | 5,860 | 4,848 | 1,356 | 1,914 | 1,210 |
| 2002 | 5,785 | 4,083 | 1,445 | 2,064 | 1,548 |
| 2003 | 5,719 | 4,578 | 1,549 | 2,075 | 1,463 |
| 2004 | 5,575 | 5,042 | 1,616 | 2,150 | 1,280 |
| 2005 | 5,263 | 4,816 | 1,633 | 2,217 | 1,460 |
| 2006 | 5,066 | 4,783 | 1,802 | 2,238 | 1,295 |
| 2007 | 4,982 | 5,388 | 1,888 | 2,006 | 749 |
| 2008 | 5,066 | 5,415 | 1,956 | 1,887 | 525 |
| 2009 | 5,398 | 4,355 | 1,943 | 1,940 | 775 |
| 2010 | 5,459 | 4,553 | 1,970 | 2,054 | 636 |
| 2011 | 5,525 | 4,209 | 2,225 | 2,015 | 486 |
| 2012 | 6,523 | 4,031 | 2,425 | 1,811 | 260 |
| 2013 | 7,360 | 3,493 | 2,579 | 1,598 | 60 |
| 2014 | 8,477 | 3,005 | 2,882 | 1,483 | n/a |
| 2015 | 9,259 | 2,673 | 3,169 | 1,515 | 6 |
| 2016 | 8,326 | 3,180 | 3,227 | 1,437 | 6 |
| 2017 | 7,968 | 3,117 | 3,446 | 1,364 | 42 |
| 2018 | 8,911 | 2,583 | 3,707 | 1,300 | 178 |
| 2019 | 9,263 | 1,481 | 3,814 | 1,321 | 185 |
| 2020 | 8,313 | 815 | 3,596 | 1,259 | 205 |
| 2021 | 8,019 | 798 | 3,760 | 1,169 | 387 |
| 2022 | 7,830 | 979 | 3,798 | 1,339 | 165 |
| 2023 | 8,840 | 1,032 | 3,885 | 1,440 | 132 |
| 2024 | 9,207 | 1,015 | 4,062 | 1,314 | 197 |
| 2025 | 9,673 | 860 | 3,910 | 1,251 | 148 |
Over 50 years, America’s crude oil supply mix was transformed. Domestic supply recovered, Canada became the dominant foreign supplier, and OPEC moved into a much smaller role.
In 1975, OPEC’s share was more than five times Canada’s. By 2025, Canada’s share was more than four times OPEC’s.
Learn More on the Voronoi App
To learn more about crude oil trade around the world, check out this post on who supplies China’s crude oil on Voronoi.