How the World’s Biggest Economies Trade With the U.S. and China
This was originally posted on our Voronoi app. Download the app for free on iOS or Android and discover incredible data-driven charts from a variety of trusted sources.
Key Takeaways:
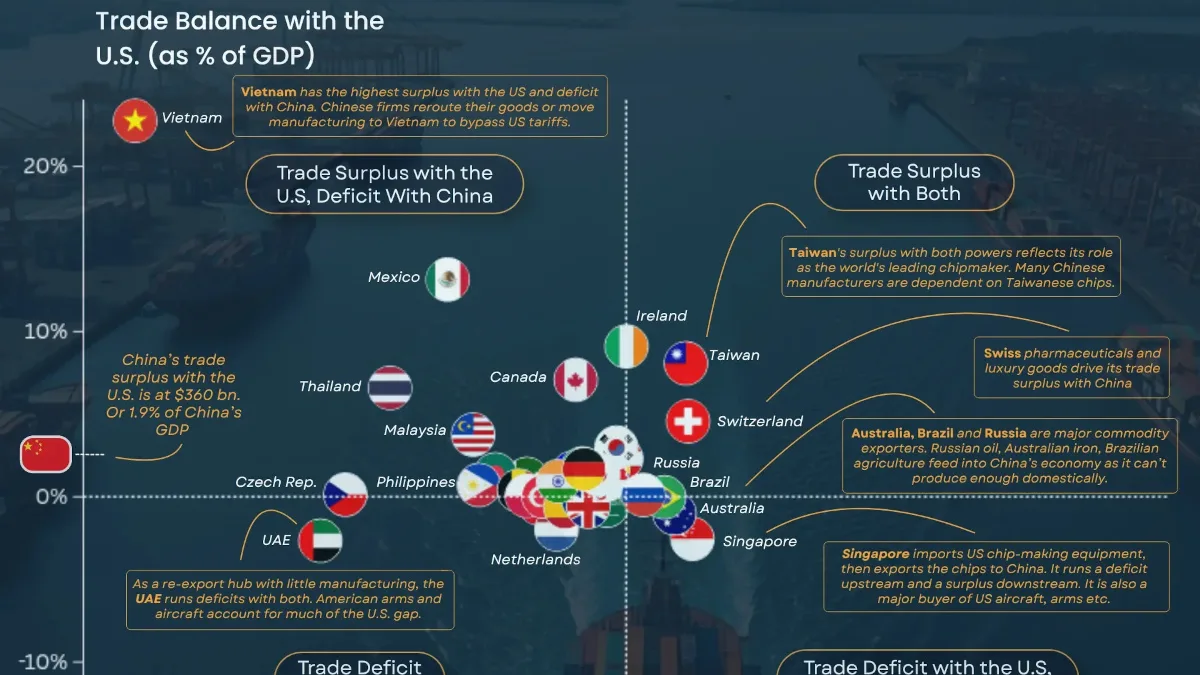
- Most of the world’s largest economies run a trade surplus with the U.S. while importing more from China, reflecting America’s role as a consumer market and China’s position as a manufacturing powerhouse.
- Taiwan and Ireland stand out by posting trade surpluses with both the U.S. and China, driven by semiconductors and pharmaceuticals, respectively.
- Vietnam records the largest surplus with the U.S. relative to GDP, highlighting its growing role in global supply chains.
Trade flows often reveal relationships that GDP alone cannot.
This visualization, created by Iswardi Ishak, charts trade balances with both the U.S. and China across the world’s 40 largest economies, showing which countries depend on American consumers, Chinese manufacturing, or both.
Using bilateral trade data from Trade Map, the chart highlights several distinct patterns, from export hubs like Vietnam and Taiwan to commodity suppliers such as Australia and Brazil. Together, they show how countries occupy very different positions within today’s global trading system.
Trade Balances Between Major Economies
Here’s a look at trade balances with the U.S. and China among the world’s largest economies:
| Country | Nominal GDP ($B) | Trade Balance with U.S. as % of GDP |
Trade Balance with China as % of GDP |
|---|---|---|---|
 Argentina Argentina |
637.2 | 0.04% | -0.89% |
 Australia Australia |
1,800 | -1.01% | 1.78% |
 Austria Austria |
534.6 | 2.31% | -0.18% |
 Bangladesh Bangladesh |
450.5 | 1.35% | -4.82% |
 Belgium Belgium |
671.7 | 0.37% | -3.96% |
 Brazil Brazil |
2,190 | -0.03% | 1.40% |
 Canada Canada |
2,270 | 7.08% | -1.86% |
 Colombia Colombia |
420.5 | -0.40% | -3.22% |
 Czech Republic Czech Republic |
347.1 | 0.13% | -10.35% |
 Denmark Denmark |
424.5 | 0.08% | -1.38% |
 France France |
3,160 | -0.18% | -1.59% |
 Germany Germany |
4,680 | 1.67% | -1.55% |
 India India |
3,760 | 0.94% | -2.51% |
 Indonesia Indonesia |
1,400 | 1.03% | -0.74% |
 Ireland Ireland |
609.0 | 9.10% | 0.01% |
 Israel Israel |
542.3 | 1.46% | -1.97% |
 Italy Italy |
2380 | 1.71% | -1.62% |
 Japan Japan |
4190 | 1.35% | -1.02% |
 Malaysia Malaysia |
422.2 | 3.76% | -5.64% |
 Mexico Mexico |
1830 | 13.15% | -6.58% |
 Netherlands Netherlands |
1210 | -1.97% | -2.57% |
 Norway Norway |
500.9 | -0.38% | -1.60% |
 Pakistan Pakistan |
372.2 | 1.08% | -3.66% |
 Philippines Philippines |
461.6 | 0.71% | -5.43% |
 Poland Poland |
917.6 | 0.06% | -3.66% |
 Romania Romania |
382.7 | 0.28% | -2.02% |
 Russia Russia |
2190 | 0.11% | 0.63% |
 Saudi Arabia Saudi Arabia |
1250 | -0.54% | -0.71% |
 Singapore Singapore |
572.9 | -2.05% | 2.44% |
 South Africa South Africa |
401.1 | 0.31% | -2.33% |
 South Korea South Korea |
1,880 | 2.98% | -0.36% |
 Spain Spain |
1,730 | -0.63% | -2.25% |
 Sweden Sweden |
604.8 | 1.66% | -0.67% |
 Switzerland Switzerland |
970.2 | 4.57% | 2.28% |
 Taiwan Taiwan |
801.5 | 8.08% | 2.20% |
 Thailand Thailand |
529.4 | 6.59% | -8.70% |
 Turkey Turkey |
1,360 | 0.01% | -3.05% |
 United Arab Emirates United Arab Emirates |
552.3 | -2.66% | -11.27% |
 United Kingdom United Kingdom |
3,700 | -0.60% | -1.40% |
 Vietnam Vietnam |
459.5 | 22.76% | -18.09% |
Rather than splitting into two competing blocs, many economies occupy a middle ground. A common pattern is running a trade surplus with the U.S. while importing more from China, reflecting America’s role as a destination for finished goods and China’s role as a supplier of manufactured inputs.
A smaller group, including Taiwan and Ireland, maintains trade surpluses with both economies through high-value exports.
China Sits at the Center of Global Supply Chains
China records trade surpluses with most of the world’s largest economies, underscoring its position as one of the world’s key manufacturing hubs. According to the Observatory of Economic Complexity, Chinese exports to the U.S. alone span everything from electronics and machinery to consumer goods and industrial components.
That helps explain why many countries simultaneously export heavily to the U.S. while importing from China. Rather than competing directly, the two economies often occupy different stages of global supply chains.
Even as some multinational firms pursue “China plus one” strategies to diversify manufacturing, China remains deeply embedded in global trade networks.
The U.S. Remains the World’s Biggest Buyer
On the other side of the equation, the U.S. continues to post persistent trade deficits with many major economies. America imports vast quantities of manufactured goods, consumer electronics, vehicles, and industrial products from overseas.
The imbalance has long been a source of political tension in Washington. According to the Council on Foreign Relations, disputes over tariffs, industrial subsidies, intellectual property, and technology access have fueled years of friction between the two superpowers.
The contrast between the two systems is striking: China produces and exports at scale, while the U.S. consumes and imports at scale. That imbalance has become a central issue in debates over economic resilience and domestic manufacturing.
Why These Trade Patterns Matter
Trade balances have become increasingly important as governments seek to strengthen domestic manufacturing and reduce supply chain risks. Tariffs, export controls, and industrial subsidies have all reshaped trade policy in recent years, yet the chart shows that many countries remain deeply integrated with both the U.S. and China.
Global trade has adapted rather than split into separate economic blocs. Many countries still rely on Chinese supply chains, American consumers, or both, even as policymakers push for more resilient and diversified trade relationships.
However, both economies remain deeply dependent on bilateral trade despite years of political tensions.
Learn More on the Voronoi App 
To learn more about how countries build global trade networks, check out Number of Trade Agreements Across 30 Economies on the Voronoi app.