

Cumulative solar photovoltaic (PV) manufacturing capital expenditure (capex) in the United States, since the introduction of the Inflation Reduction Act in 2022, is forecast to reach $12.2 billion by the end of 2026, accounting more than 50% of all solar PV manufacturing spending since 2001.
This analysis is taken directly from the new Solar Manufacturing USA Quarterly report, released today by Terawatt PV Research – with the research undertaken by the company’s founder and author of this article, drawing on experience of scrutinizing the operations of more than 500 solar PV manufacturers globally since the solar industry moved from R&D to commercial status more than two decades ago.
The new U.S.-specific report returns to the fundamental building-blocks required to understand key quarterly metrics at individual PV manufacturing sites: effective ramped capacity, production output, technology segmentation and manufacturing capex.
Moreover, for the first time, the depth of coverage on PV manufacturing capex has been extended beyond simply equipment-spending at the company level.
The new analysis now segments PV manufacturing capex at the quarterly level for individual manufacturing sites in the United States and further splits the company/site/value-chain/technology-specific manufacturing capex across buildings/infrastructure, new production equipment and maintenance/upgrades.
The net result is unprecedented visibility on the U.S. solar manufacturing sector and the individual companies currently in production, building/equipping new PV factories or adding capacity within existing operating sites.
Furthermore, the consolidated totals provide a highly accurate picture of the entire domestic solar PV manufacturing landscape in the United States today, allowing forecasting out to 2030 to be undertaken with greater levels of confidence.
Capital expenditure levels at global highs for greenfield cell spending
The new report focuses on company-specific manufacturing sites in production since 2020, leading into the Inflation Reduction Act in 2022, the subsequent uptick in manufacturing capex from 2023 until today, and bottom-up forecasting out to the end of 2030 factoring in the impact of new investments arising from Section 232.
In reviewing the consolidated totals, solar PV manufacturing capex since the Inflation Reduction Act was introduced has been a gamechanger for the domestic U.S. PV manufacturing sector.
U.S. solar PV manufacturing capex has exceeded $2.5 billion each year since 2023. A record $4.14 billion was spent on PV manufacturing capex in the United States during 2024, with more than 60% coming that year from just two companies – First Solar (mainly through its spending on new factories in Alabama and Louisiana), and Qcells (part of Hanwha Solutions) from its vertically-integrated investments in Georgia.
Segmenting U.S. manufacturing capex now across buildings/infrastructure, new production equipment and maintenance/upgrades reveals some important dynamics at play for domestic PV production sites today, with the allocations to buildings/infrastructure varying strongly between refitting an existing warehouse for module assembly to building a dedicated greenfield site for solar cell manufacturing (by more than an order of magnitude on a per-installed-Watt basis).
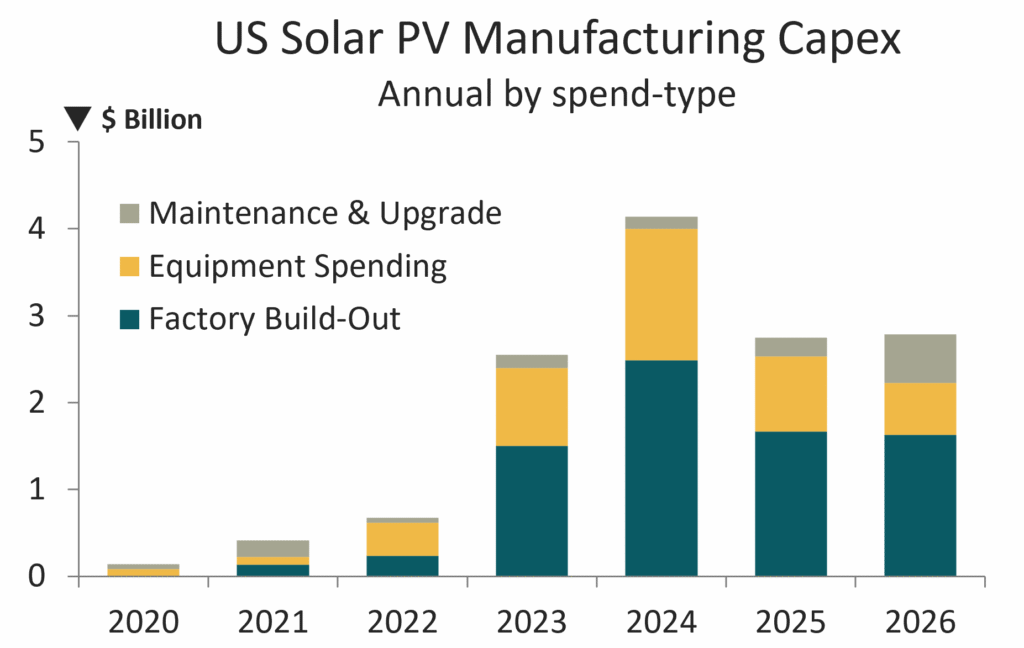
Figure 1: Solar PV manufacturing capital expenditure has grown significantly since the introduction of the Inflation Reduction Act at the end of 2022, with factory build-out spending from buildings/infrastructure costs accounting for about 60% of the total spend during the 2023-2026 period.
Effective capacity, capacity-conversion rates and actual production
For more than 20 years, analyzing the details behind PV manufacturing capex injected into the global solar industry has been pivotal in understanding how new capacity or upgrade-spending are ramped into production; and how the announced capacities translate into production volumes at any given time.
The specifics behind how solar PV manufacturing capex was spent across Japan, Taiwan, South Korea, India, China and Southeast Asia during 1990-2024 played a key part in the evolution of global PV manufacturing and technology during this high-growth sector phase; not to forget the manufacturing capex into thin-film technologies in the United States 15-20 years ago that had very different consequences.
Capex, capacity and production should not be difficult metrics to understand. Yet almost daily, there are misleading discussions about ‘capacity-mismatches’ through the value-chain, over-capacity ‘concerns’, and even some observers talking about the U.S. having to become an ‘exporter of solar modules’, something that has not happened since the 1990’s.
At its core, market research is about tracking capex, technology, production, shipments, pricing, costs and margins at the company and manufacturing site level. Capacity is really an issue only when forecasting production volumes in the future.
In its simplest form, production is in fact the ‘actual’ capacity of a factory at any given time. The ‘effective installed capacity’ is the maximum output of the site based on 24/7 operations and 100% yield.
Thereafter, the relationship between production and capacity is not ‘utilization’ but ‘effective capacity conversion’ and this is determined by production-line uptimes and how many shifts are being operated.
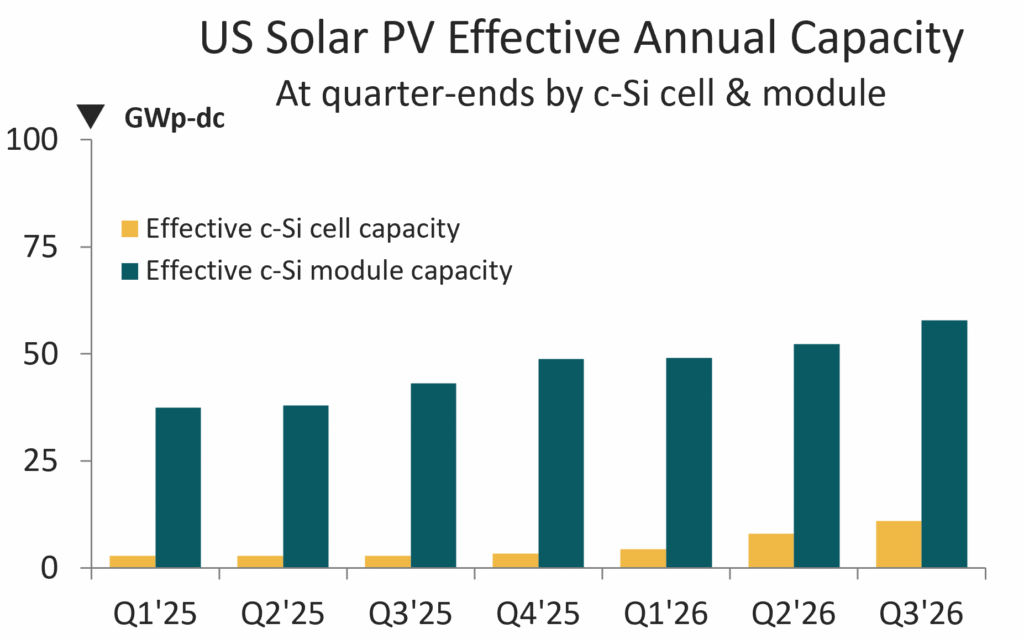
Figure 2: Effective capacity levels for c-Si cells and modules in the United States have been growing quarter-on-quarter since the start of 2025, with effective-capacity-conversion rates varying considerably at the manufacturing site level, from figures of 15-20% during early ramp-up to 70-80% from a select group of companies only. Forecasting cell and module production volumes out to 2030 ultimately frames the additional upstream capex needed to create a more balanced value-chain for silicon-based manufacturing in the United States.
Regional clusters emerging across the country
Analyzing manufacturing metrics at the site level allows for regional trends to be quickly established. Looking at the production numbers here is particularly useful in assessing where materials supplies could be strategically developed.
Currently, this type of analysis can only be applied to module production in the United States. Doing this for ingots, wafer and cells is too early.
From a state-level perspective, Ohio – by virtue of First Solar manufacturing bases – was the dominant zone for module production volumes in the United States leading into the IRA being rolled out. However, Texas is the real winner in the post-IRA era, becoming the state leader in module production in 2026 with meaningful contributions from Canadian Solar, Sirius/Elin, Imperial Star, SEG Solar, T1 Energy, TOYO/Abalance and Waaree Energies.
Elsewhere, much of the action is in the Southeast of the country, with a logical geographic split here in grouping the gulf coast corridor of Louisiana and Florida and the advanced manufacturing region including the Carolinas, Georgia and Alabama.
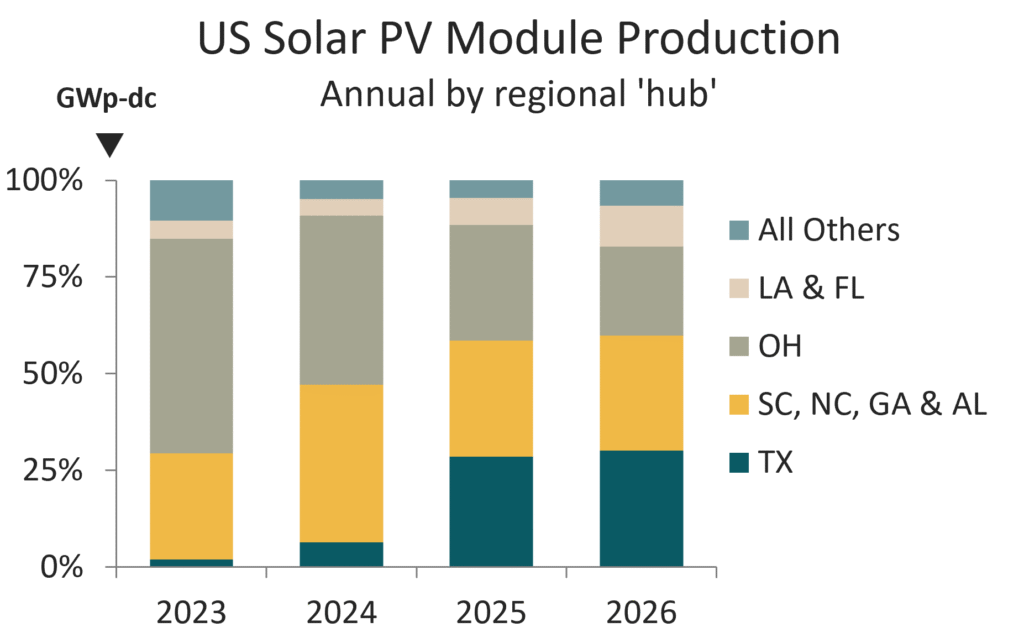
Figure 3: Solar module production in the United States shows strong state-level and regional bias, with Texas emerging now as the major hub for c-Si module assembly, with leading proponents such as Canadian Solar, SEG Solar and T1 Energy.
Ranking and rating U.S. solar PV manufacturers
The final output of the new report is to rank and rate the companies analyzed individually in the report.
This step is essential to allow greater emphasis to be placed on tracking the manufacturing decisions taken by the top 20 companies in the U.S. solar sector at any time, given that this subset of companies is typically accounting for more than 95% of all investment and production of significance.
Let’s walk through the methodology now to explain exactly how this is done.
As discussed earlier, the report is built from a newly created, proprietary, bottom-up database of U.S. solar manufacturing activity, analyzed at the individual manufacturing-site level by quarter.
Production is tracked across the c-Si value-chain from polysilicon through modules, together with segmented thin-film ‘cell’ and ‘module’ output equivalence.
Capex is further segmented between buildings and infrastructure, production equipment, and maintenance and upgrades; while excluding R&D contributions to capex.
The underlying data draws on audited filings and company reporting where available, supplemented by bespoke market research analysis based on additional operational and industry evidence and personal communications.
This approach allows current manufacturing activity (production) and the strongest leading indicator of future production growth – capital investment in manufacturing, or ‘manufacturing capex’ – to be assessed within a consistent analytical framework.
Production and capex are independently subjected to statistical transformation and normalization before being combined through a weighted methodology to generate a Manufacturing Strength score for each company.
An operating-production screening process prevents companies with little or no realized production output from being elevated solely by announced or early-stage capital spending.
The resulting scores determine company rankings, while a standardized Z-score analysis measures each qualifying manufacturer relative to the wider U.S. peer-group distribution and forms the basis of the AAA-to-C Manufacturing Strength ratings presented in the report’s ratings hierarchy which is logically presented visually as a truncated pyramid.
Ratings are displayed on an annual basis, with each quarterly report updating the underlying production and capex assumptions — and therefore the forecasted full-year ranking and rating — as new evidence emerges.
The methodology is summarized in the process-flow chart below, which shows how the underlying site-level data architecture feeds into the two core inputs of Production and Capex, how these are independently processed and combined, and how the resulting Manufacturing Strength scores are converted into company Rankings and Ratings.
The first Manufacturing Strength Ratings Pyramid for U.S. solar PV manufacturers will be revealed during my opening talk at the Solar Manufacturing USA 2026 conference in Austin, Texas on 22-23 September 2026.
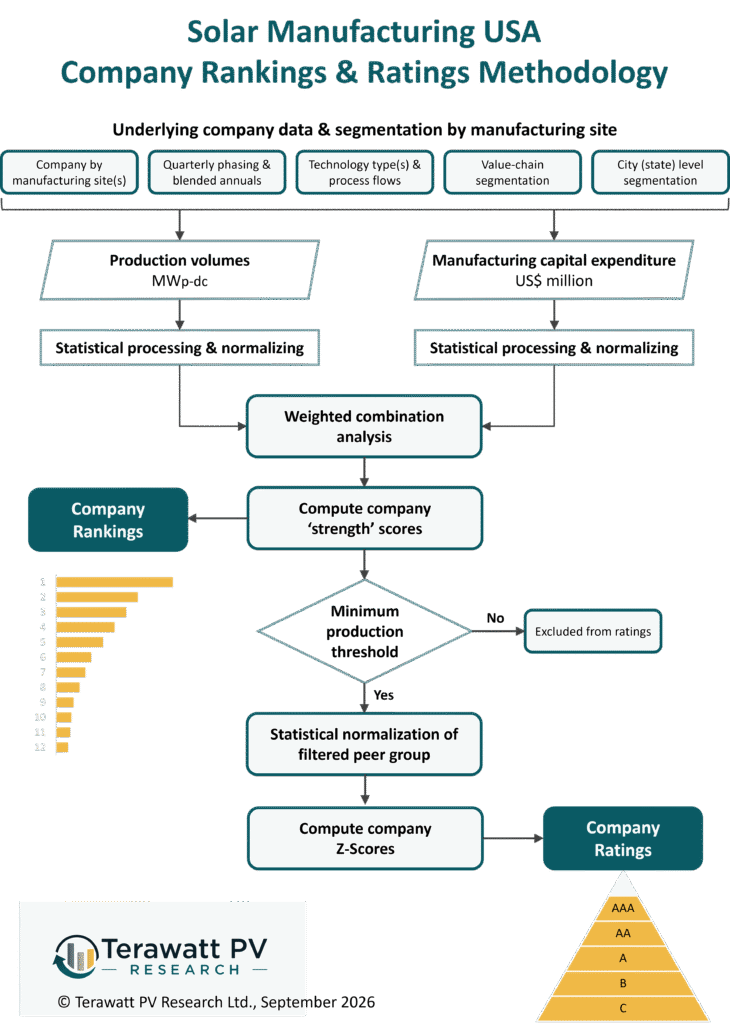
Figure 4: Manufacturing Strength ratings flowchart showing how site-level production and capex data are statistically processed, combined and converted into company rankings and annual AAA–C ratings for all solar PV manufacturers in the United States today.
Accessing the new report
The Terawatt PV Research Solar Manufacturing USA Quarterly report is released today, with the first quarterly deliverable scheduled for the start of October 2026, when the analysis for Q3 2026 is completed.
All report enquiries and subscriptions are being managed exclusively by pv magazine USA, extending the working partnership between the parties that led to the launch of the Solar Manufacturing USA event in 2026.
To register your interest in the report, please send an email to: solarmfgusa@pv-magazine.com
The post IRA-stimulated U.S. solar manufacturing capex to reach $12.2 billion by end 2026 appeared first on pv magazine Global.


