Which utilities lead on decarbonization?
Key Takeaways
- PSEG has the lowest emissions intensity among the major investor-owned utilities in the U.S., followed by Avangrid and PG&E.
- Avangrid sits in the 2030s target group, the earliest decade shown in the dataset.
- TransAlta reports 11 Scope 3 categories, the broadest coverage shown.
The U.S. power sector is balancing rising electricity demand with the push toward lower-carbon generation. Emissions, targets, and disclosure practices therefore tell different parts of the story.
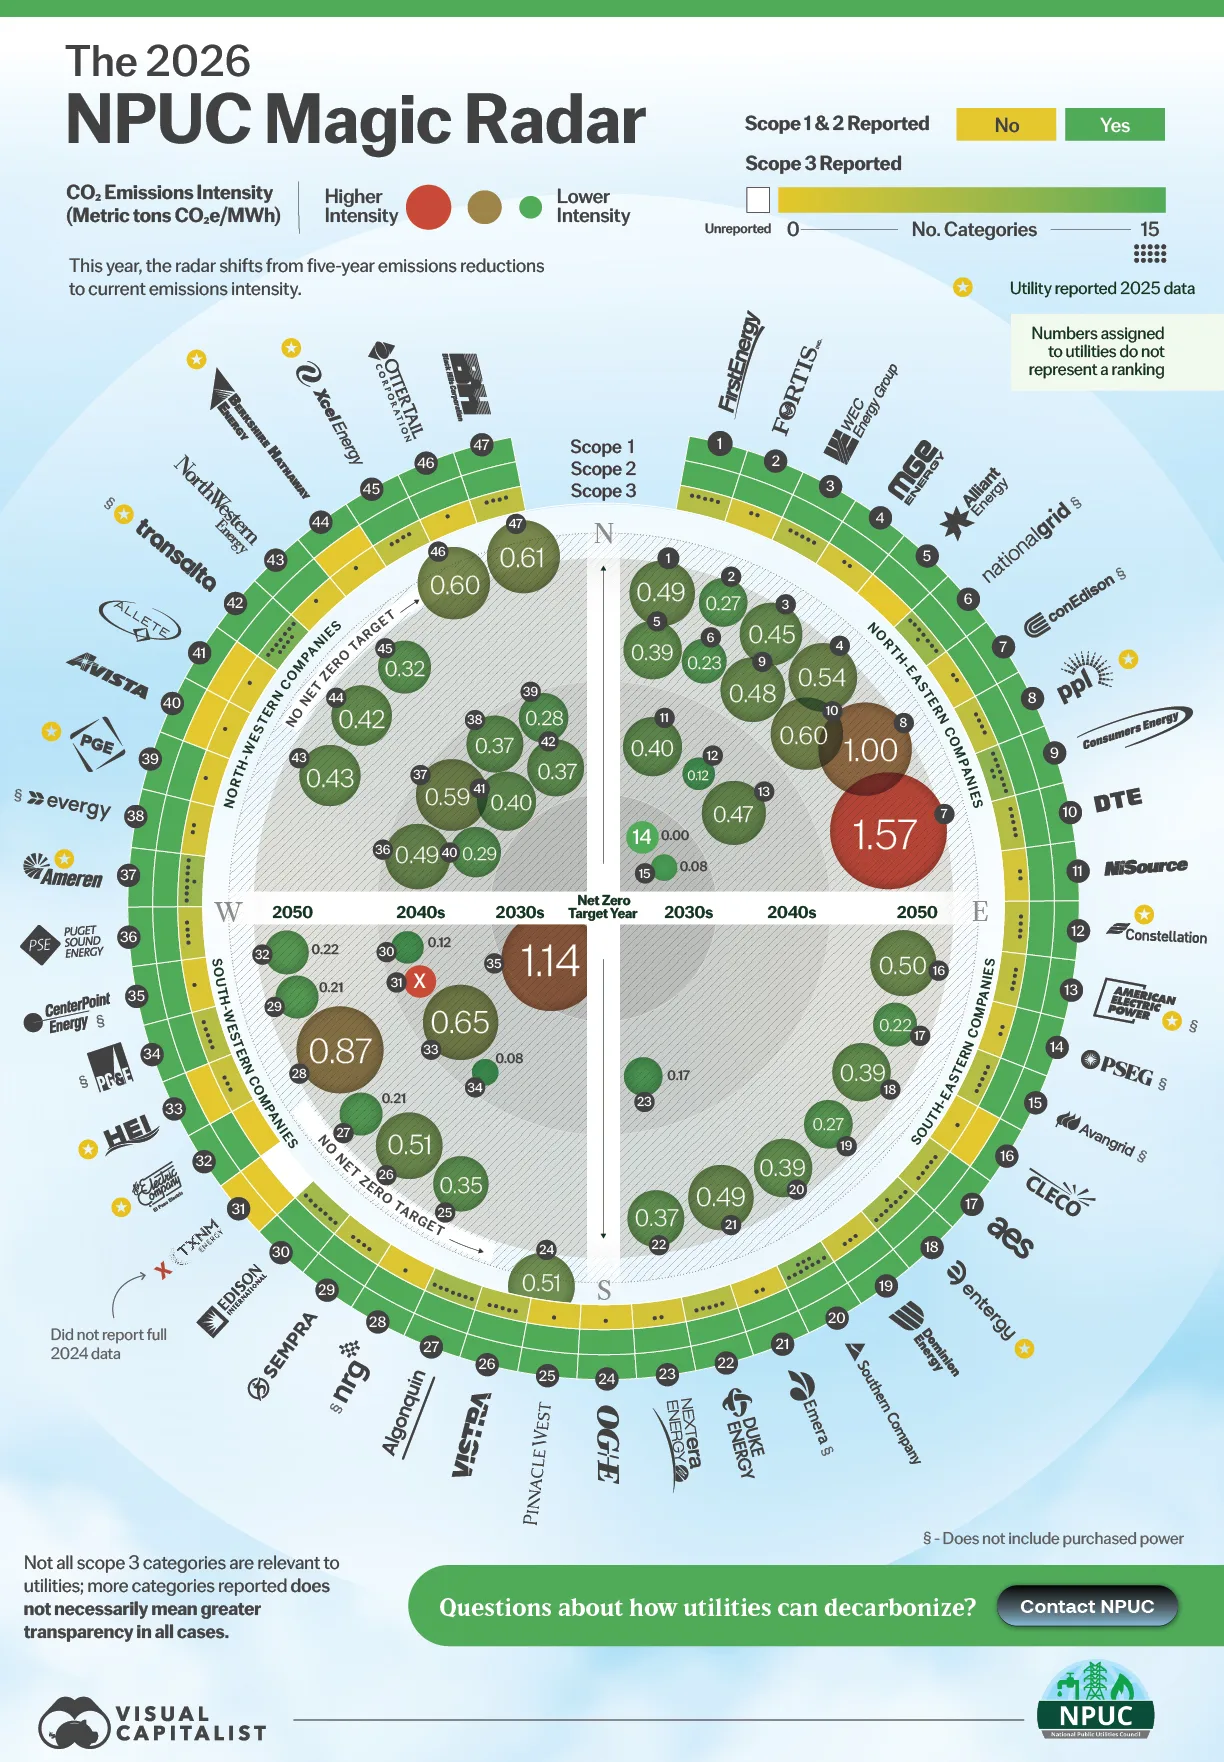
This graphic, in partnership with the National Public Utilities Council, shows the decarbonization profiles of 47 U.S. investor-owned utilities using data from EEI, CDP, and company sustainability reports.
A Broader View of Utility Decarbonization
The Magic Radar does not rank utilities. Instead, it combines emissions intensity, target timing, Scope 1 and 2 reporting, and the breadth of reported Scope 3 categories.
Here is a table that shows emissions intensity, reporting coverage, and net-zero goal decade for the 47 utilities.
| Utility | Scope 1 reported | Scope 2 reported | Scope 3 categories reported | Net-zero goal decade | Emissions intensity (tCO₂e/MWh) |
|---|---|---|---|---|---|
| AES Corporation | Yes | Yes | 5 | 2050s | 0.22 |
| Algonquin Power & Utilities | Yes | Yes | 7 | 2050s | 0.21 |
| Allete Energy | Yes | No | 1 | 2040s | 0.40 |
| Alliant Energy | Yes | Yes | 0 | 2050s | 0.39 |
Ameren  |
Yes | Yes | 8 | 2040s | 0.59 |
| American Electric Power § |
Yes | Yes | 4 | 2040s | 0.47 |
| Avangrid§ | Yes | Yes | 5 | 2030s | 0.08 |
| Avista Utilities | Yes | No | 1 | 2040s | 0.29 |
| Berkshire Hathaway Energy |
Yes | No | 1 | 2050s | 0.42 |
| Black Hills Corporation | Yes | Yes | 4 | No net-zero target | 0.61 |
| CenterPoint Energy§ | Yes | Yes | 1 | 2030s | 1.14 |
| Cleco Power LLC | Yes | No | 1 | 2050s | 0.5 |
| Consolidated Edison§ | Yes | Yes | 2 | 2050s | 1.57 |
| Constellation Energy |
Yes | Yes | 4 | 2040s | 0.12 |
| Consumers Energy | Yes | Yes | 9 | 2050s | 0.48 |
| Dominion Energy | Yes | Yes | 3 | 2050s | 0.27 |
| DTE Energy Company | Yes | Yes | 5 | 2050s | 0.60 |
| Duke Energy | Yes | Yes | 5 | 2050s | 0.37 |
| Edison International | Yes | Yes | 7 | 2040s | 0.12 |
| El Paso Electric |
Yes | Yes | 0 | 2040s | 0.22 |
| Emera§ | Yes | Yes | 2 | 2050s | 0.49 |
| Entergy |
Yes | Yes | 8 | 2050s | 0.39 |
| Evergy§ | Yes | Yes | 2 | 2040s | 0.37 |
| FirstEnergy | Yes | Yes | 5 | 2050s | 0.49 |
| Fortis Inc. | Yes | Yes | 2 | 2050s | 0.27 |
| Hawaiian Electric Industries |
Yes | No | 3 | 2040s | 0.65 |
| MGE Energy | Yes | Yes | 2 | 2050s | 0.54 |
| National Grid PLC§ | Yes | Yes | 8 | 2050s | 0.23 |
| NextEra Energy | Yes | Yes | 2 | No net-zero target | 0.17 |
| NiSource | Yes | Yes | 2 | 2040s | 0.40 |
| NorthWestern Corporation | Yes | Yes | 1 | 2050s | 0.43 |
| NRG Energy§ | Yes | Yes | 1 | 2050s | 0.87 |
| OG&E Energy | Yes | Yes | 1 | No net-zero target | 0.51 |
| Otter Tail Corporation | Yes | Yes | 1 | No net-zero target | 0.60 |
| Pacific Gas and Electric§ | Yes | Yes | 5 | 2040s | 0.08 |
| Pinnacle West Capital | Yes | Yes | 1 | 2050s | 0.35 |
PNM Resources  |
No | No | 0 | N/A | N/A |
| Portland General Electric |
Yes | Yes | 1 | 2040s | 0.28 |
| PPL Corporation |
Yes | Yes | 4 | 2050s | 1.00 |
| Public Service Enterprise Group§ | Yes | Yes | 2 | 2050s | 0.00 |
| Puget Sound Energy (PSE) | Yes | Yes | 4 | 2040s | 0.49 |
| Sempra Energy | Yes | Yes | 4 | 2050s | 0.21 |
| Southern Company | Yes | Yes | 10 | 2050s | 0.39 |
| TransAlta § |
Yes | Yes | 11 | 2040s | 0.37 |
| Vistra | Yes | Yes | 5 | 2050s | 0.51 |
| WEC Energy | Yes | Yes | 5 | 2050s | 0.45 |
| Xcel Energy |
Yes | Yes | 4 | 2050s | 0.32 |
Methodology
indicates the utility released 2025 data. § indicates purchased power is not included for the utility’s relevant emissions data. Values with this symbol are therefore not directly comparable on exactly the same reporting boundary. indicates the utility had not released full 2024 data when the data was collected this year.
PSEG, Avangrid, and PG&E stand out for low reported emissions intensity. PSEG’s rounded intensity is 0.00, but is precisely 0.0001 tCO₂e/MWh, while Avangrid and PG&E each report 0.08.
Separately, the California Energy Commission reports that PG&E-owned Diablo Canyon supplies about 17% of California’s zero-carbon electricity, adding context to the utility’s low reported emissions intensity.
Meanwhile, renewables have reached new highs in U.S. electricity generation. This radar shows how U.S. utilities differ within that transition.
Targets and Reporting Tell Another Story
Target dates vary widely, and their underlying commitments are subject to change each year. Some utilities net zero goals include scope 3 emissions, while others don’t.
Avangrid’s net zero goal is slated for the 2030s, while PSEG’s goal is set for 2050 and PG&E in the 2040s.
TransAlta reports the broadest Scope 3 disclosures with 11 categories, followed by Southern Company with 10. However, more categories do not automatically indicate greater transparency because not every Scope 3 category applies equally to every utility.
A Complex Transition in One View
The radar shows why no single metric tells the whole decarbonization story. Utilities can pair low emissions intensity with different target timelines, reporting approaches, and emissions trajectories.
Together, these measures provide a fuller view of the utility transition.
-
 Energy1 month ago
The Rising Cost of Electricity in the United States
Washington, DC had the largest increase in electricity prices from 2020 to 2025, while North Dakota saw the biggest decline.
-
 Technology2 months ago
U.S. Battery Capacity Growth Forecast: 2026–2031
See how U.S. carbon offsets break down by project type in 2026, from forestry to methane, refrigerants, and wind.
-
 Energy3 months ago
Ranked: Countries Building the Most Small Modular Nuclear Reactors
Small Modular Nuclear Reactors are moving from concept to siting, with the U.S. leading at 28 announcements as power demand surges.
-
 Energy1 year ago
Ranked: The Top 10 Cleanest Operating Utilities In The U.S.
Just four U.S. utilities operate with over 80% carbon-free generation. This graphic ranks the top 10 cleanest utilities by their fuel mix.