Mapped: America’s Deadliest States for Workers
See visuals like this from many other data creators on our Voronoi app. Download it for free on iOS or Android and discover incredible data-driven charts from a variety of trusted sources.
Key Takeaways
- Wyoming’s workplace fatality rate was nearly 13 times higher than Rhode Island’s in 2024.
- Energy, mining, trucking, and agriculture-heavy states recorded America’s highest workplace death rates.
- Most Northeastern states ranked among the safest due to larger service-sector economies.
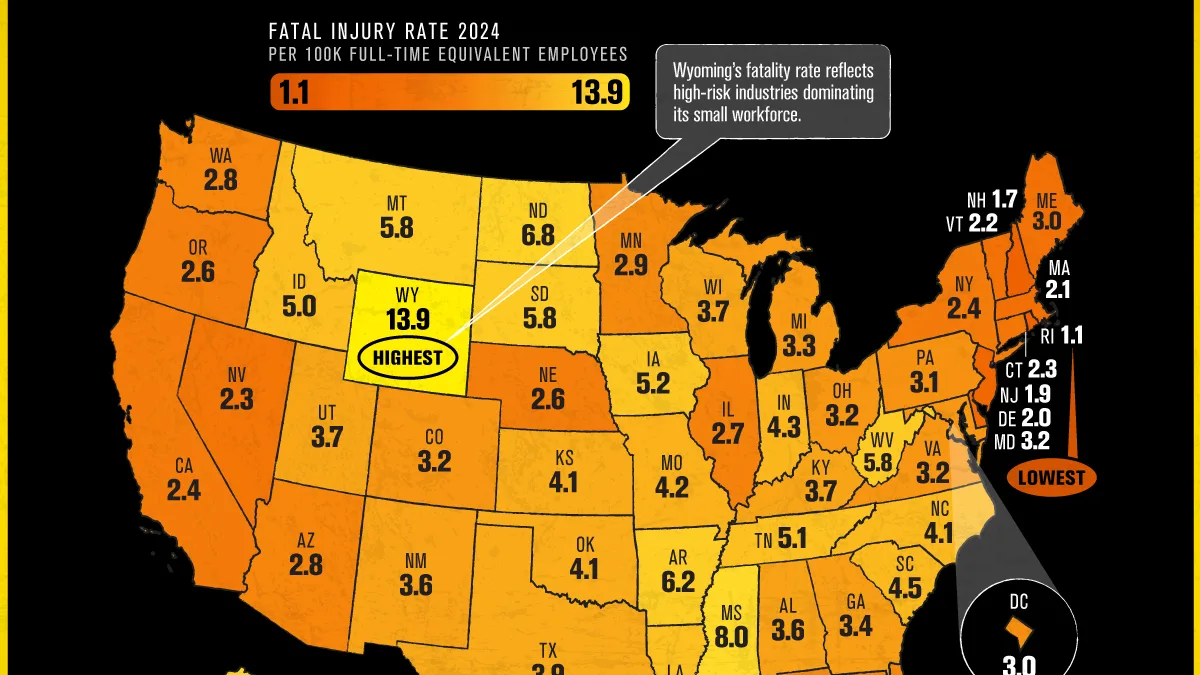
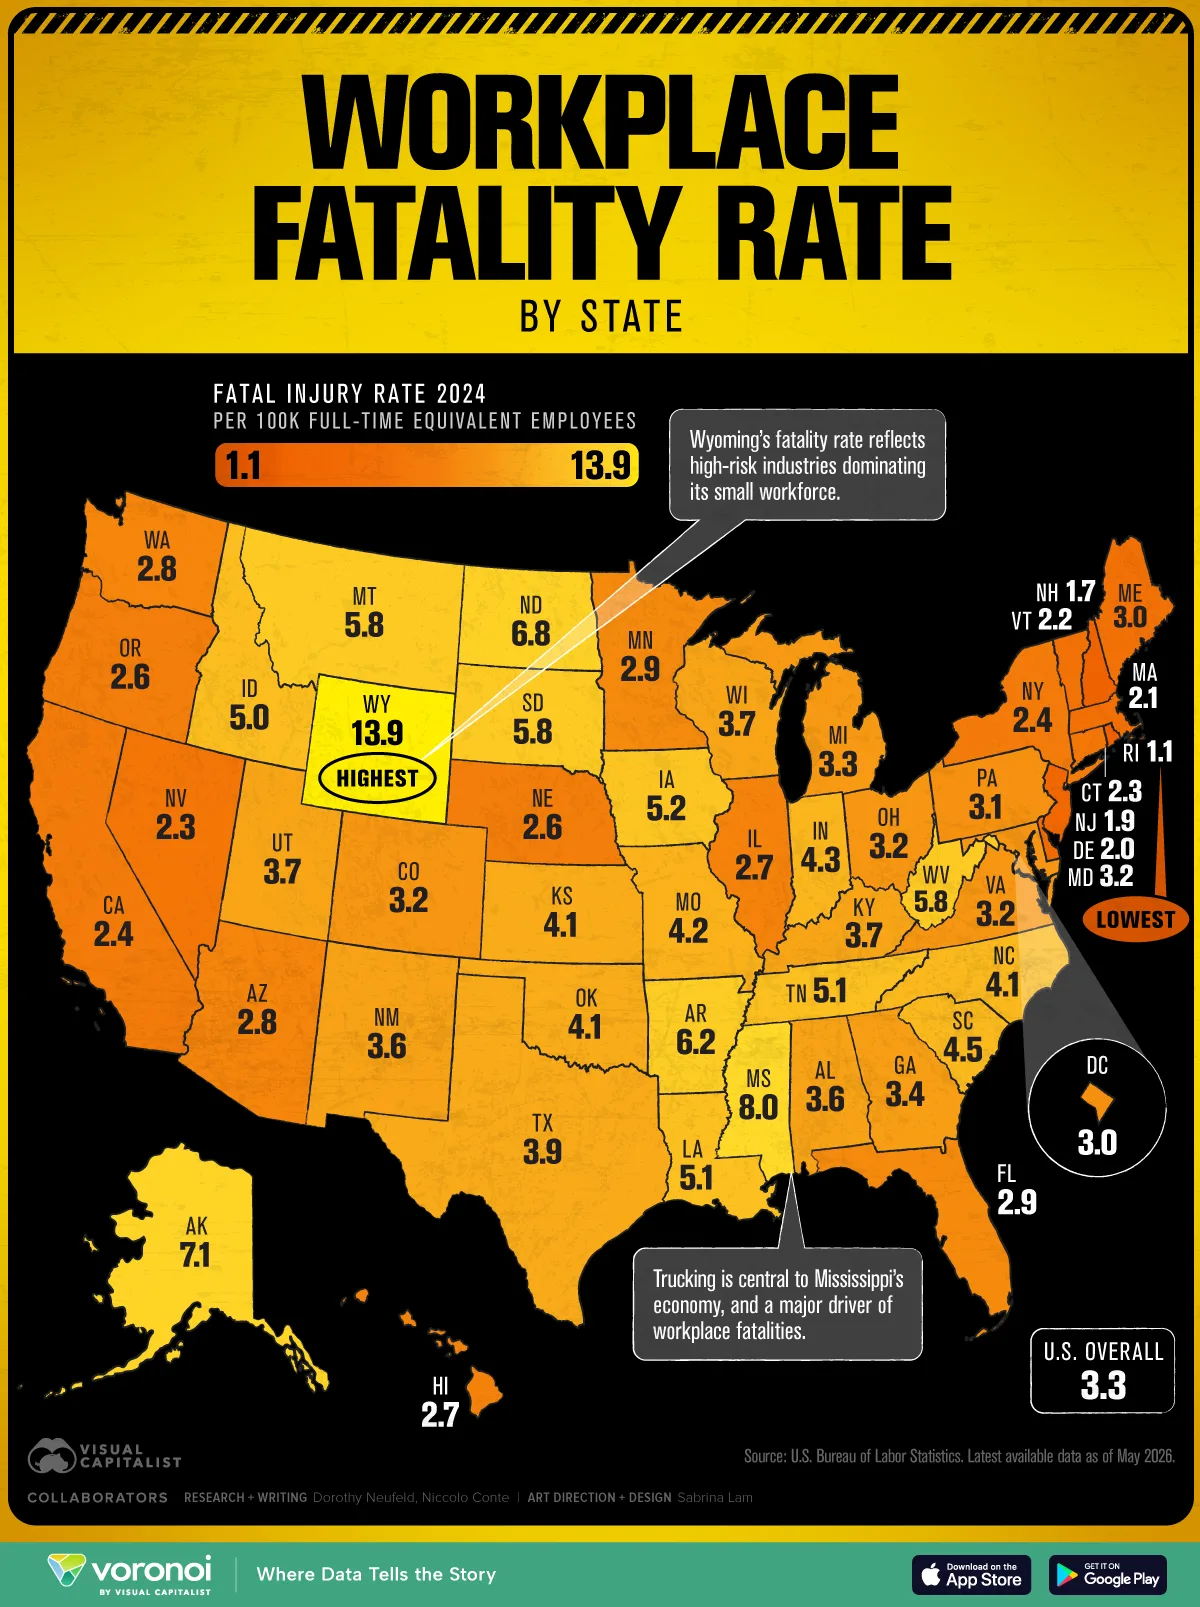
Using data from the U.S. Bureau of Labor Statistics (BLS), this map shows workplace fatality rates across all 50 states in 2024.
Wyoming recorded the nation’s highest workplace fatality rate at 13.9 deaths per 100,000 workers, compared with just 1.1 in Rhode Island. Several Southern and Mountain West states also reported rates well above the national average of 3.3.
The state-level divide highlights how workplace risk remains concentrated in specific industries and regions across the U.S. economy.
Why Resource-Heavy States Rank So High
In states like Wyoming and North Dakota, oil and gas extraction remains a major source of employment. These industries often involve remote job sites, heavy equipment, long shifts, and hazardous operating conditions.
The concentration is especially visible in the data. Roughly 30% of Wyoming’s workplace deaths in 2024 occurred in natural resources and mining, while the industry accounted for nearly half of all workplace fatalities in North Dakota.
| Rank | State | Fatal Injury Rate 2024 (per 100K full-time equivalent employees) |
|---|---|---|
| 1 | Wyoming | 13.9 |
| 2 | Mississippi | 8.0 |
| 3 | Alaska | 7.1 |
| 4 | North Dakota | 6.8 |
| 5 | Arkansas | 6.2 |
| 6 | Montana | 5.8 |
| 7 | South Dakota | 5.8 |
| 8 | West Virginia | 5.8 |
| 9 | Iowa | 5.2 |
| 10 | Louisiana | 5.1 |
| 11 | Tennessee | 5.1 |
| 12 | Idaho | 5.0 |
| 13 | South Carolina | 4.5 |
| 14 | Indiana | 4.3 |
| 15 | Missouri | 4.2 |
| 16 | Kansas | 4.1 |
| 17 | North Carolina | 4.1 |
| 18 | Oklahoma | 4.1 |
| 19 | Texas | 3.9 |
| 20 | Kentucky | 3.7 |
| 21 | Utah | 3.7 |
| 22 | Wisconsin | 3.7 |
| 23 | Alabama | 3.6 |
| 24 | New Mexico | 3.6 |
| 25 | Georgia | 3.4 |
| 26 | Michigan | 3.3 |
| 27 | Colorado | 3.2 |
| 28 | Maryland | 3.2 |
| 29 | Ohio | 3.2 |
| 30 | Virginia | 3.2 |
| 31 | Pennsylvania | 3.1 |
| 32 | District of Columbia | 3.0 |
| 33 | Maine | 3.0 |
| 34 | Florida | 2.9 |
| 35 | Minnesota | 2.9 |
| 36 | Arizona | 2.8 |
| 37 | Washington | 2.8 |
| 38 | Hawaii | 2.7 |
| 39 | Illinois | 2.7 |
| 40 | Nebraska | 2.6 |
| 41 | Oregon | 2.6 |
| 42 | California | 2.4 |
| 43 | New York | 2.4 |
| 44 | Connecticut | 2.3 |
| 45 | Nevada | 2.3 |
| 46 | Vermont | 2.2 |
| 47 | Massachusetts | 2.1 |
| 48 | Delaware | 2.0 |
| 49 | New Jersey | 1.9 |
| 50 | New Hampshire | 1.7 |
| 51 | Rhode Island | 1.1 |
| — |  U.S. Average U.S. Average |
3.3 |
Agriculture and logging also contribute to elevated fatality rates across several rural states. Workers in these industries routinely operate large equipment, work outdoors in extreme conditions, and travel long distances on rural roads.
The national workplace fatality rate stood at 3.3 deaths per 100,000 workers in 2024, meaning several states recorded rates nearly double the U.S. average.
America’s Freight Corridors Also Face Higher Risks
Transportation incidents remain one of the leading causes of workplace deaths in the country.
States positioned along major freight and energy corridors often see higher concentrations of long-haul trucking, industrial transport, and warehouse activity. That includes parts of the South, Great Plains, and Mountain West.
Long driving hours, highway exposure, and physically demanding loading work all raise fatality risks for transportation workers. For instance, trucking remains central to Mississippi’s economy and is the leading industry for workplace deaths. In rural states, longer emergency response times can further worsen outcomes after serious accidents.
Why Northeastern States Tend to Be Safer
Many Northeastern states reported workplace fatality rates well below the national average in 2024.
Part of that divide comes from industry mix. States like Massachusetts, New Jersey, and Rhode Island have larger concentrations of office-based employment and fewer workers in mining, drilling, agriculture, or logging.
Higher population density may also play a role. Urbanized states tend to have shorter transportation routes, more developed infrastructure, and faster access to hospitals and emergency services.
Geography Still Shapes Workplace Risk in America
The gap between America’s safest and deadliest workplaces highlights how closely occupational risk is tied to local economies.
In many higher-risk states, dangerous industries are also some of the best-paying and most economically important. Energy, transportation, agriculture, and heavy industry continue to support thousands of jobs despite the elevated risks.
That creates a difficult tradeoff for many local economies, where some of the most economically important industries also carry the highest workplace risks.
As a result, workplace safety in America varies sharply depending on the industries that dominate each state’s economy.
Learn More on the Voronoi App 
To learn more about this topic, check out this graphic on manufacturing jobs by state.