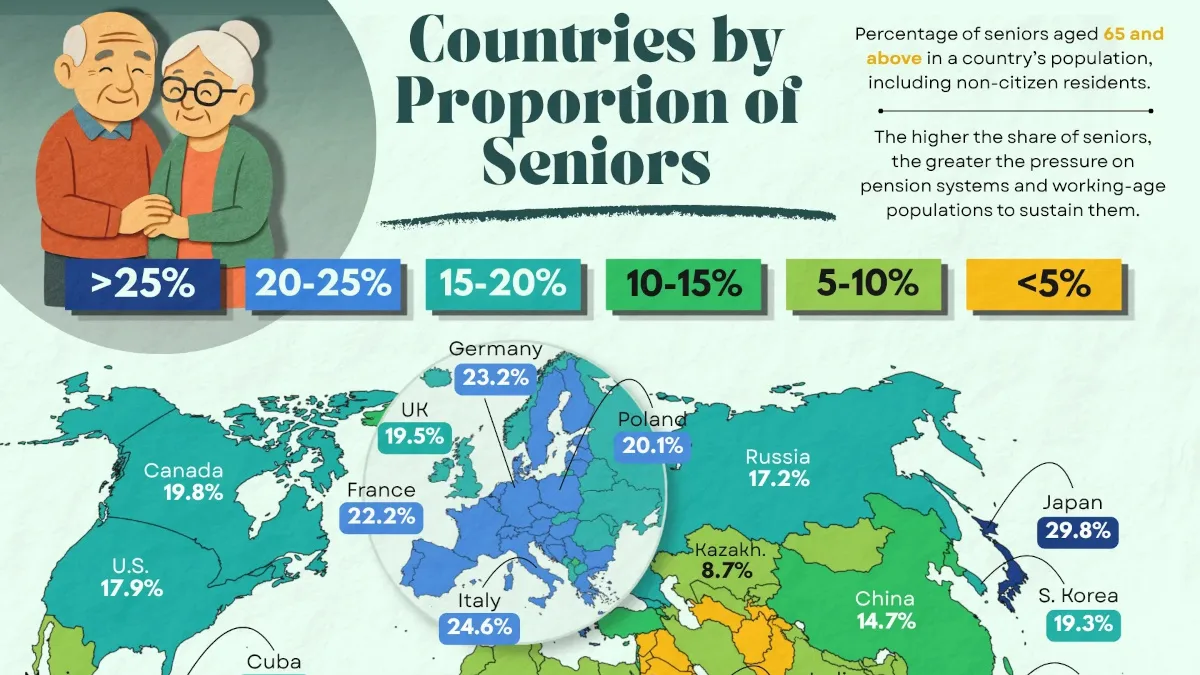
Mapped: Countries With the Most Seniors
This was originally posted on our Voronoi app. Download the app for free on iOS or Android and discover incredible data-driven charts from a variety of trusted sources.
Key Takeaways:
- Monaco has the world’s oldest population, with more than 36% of residents aged 65 or older.
- Japan ranks second and is the oldest major economy, with nearly 30% of its population over 65.
- Europe dominates the rankings, highlighting the growing demographic pressure on pensions, healthcare, and shrinking workforces.
The world is getting older, and in some countries, seniors already make up more than one-quarter of the population.
This visualization, created by Iswardi Ishak, ranks countries by the share of their population aged 65 and above, using World Bank data.
Some Countries Are Aging Faster
The table below shows the countries with the highest share of residents aged 65 and older.
| Rank | Country | % of seniors in population |
|---|---|---|
| 1 |  Monaco Monaco |
36.17 |
| 2 |  Japan Japan |
29.78 |
| 3 |  Puerto Rico (US) Puerto Rico (US) |
24.72 |
| 4 |  Italy Italy |
24.62 |
| 5 |  Portugal Portugal |
24.53 |
| 6 |  Greece Greece |
23.94 |
| 7 |  Finland Finland |
23.90 |
| 8 |  Germany Germany |
23.20 |
| 9 |  Croatia Croatia |
23.19 |
| 10 |  Isle of Man (UK) Isle of Man (UK) |
23.15 |
| 11 |  Virgin Islands (U.S.) Virgin Islands (U.S.) |
22.69 |
| 12 |  Serbia Serbia |
22.69 |
| 13 |  Hong Kong SAR, China Hong Kong SAR, China |
22.67 |
| 14 |  San Marino San Marino |
22.41 |
| 15 |  Bosnia and Herzegovina Bosnia and Herzegovina |
22.23 |
| 16 |  France France |
22.15 |
| 17 |  Bulgaria Bulgaria |
22.03 |
| 18 |  European Union European Union |
22.01 |
| 19 |  Slovenia Slovenia |
21.77 |
| 20 |  Bermuda (UK) Bermuda (UK) |
21.74 |
| 21 |  Latvia Latvia |
21.74 |
| 22 |  Estonia Estonia |
21.30 |
| 23 |  Spain Spain |
21.15 |
| 24 |  Hungary Hungary |
20.99 |
| 25 |  Denmark Denmark |
20.87 |
| 26 |  Czechia Czechia |
20.85 |
| 27 |  Sweden Sweden |
20.75 |
| 28 |  Liechtenstein Liechtenstein |
20.73 |
| 29 |  Austria Austria |
20.61 |
| 30 |  Belgium Belgium |
20.56 |
| 31 |  Netherlands Netherlands |
20.50 |
| 32 |  Malta Malta |
20.21 |
| 33 |  Lithuania Lithuania |
20.17 |
| 34 |  Poland Poland |
20.14 |
| 35 |  Switzerland Switzerland |
20.02 |
| 36 |  Romania Romania |
19.98 |
| 37 |  Canada Canada |
19.80 |
| 38 |  United Kingdom United Kingdom |
19.5 |
| 39 |  South Korea South Korea |
19.27 |
| 40 |  Ukraine Ukraine |
18.96 |
| 41 |  Norway Norway |
18.79 |
| 42 |  Slovak Republic Slovak Republic |
18.54 |
| 43 |  St. Martin (French part) St. Martin (French part) |
18.41 |
| 44 |  North Macedonia North Macedonia |
18.02 |
| 45 |  United States United States |
17.93 |
| 46 |  Montenegro Montenegro |
17.83 |
| 47 |  Faroe Islands (UK) Faroe Islands (UK) |
17.74 |
| 48 |  Australia Australia |
17.73 |
| 49 |  Belarus Belarus |
17.67 |
| 50 |  Gibraltar Gibraltar |
17.62 |
| 51 |  New Zealand New Zealand |
17.20 |
| 52 |  Russian Federation Russian Federation |
17.18 |
| 53 |  Aruba Aruba |
17.06 |
| 54 |  Albania Albania |
16.92 |
| 55 |  Curacao Curacao |
16.78 |
| 56 |  Cuba Cuba |
16.57 |
| 57 |  Barbados Barbados |
16.55 |
| 58 |  Moldova Moldova |
16.21 |
| 59 |  Uruguay Uruguay |
16.05 |
| 60 |  Andorra Andorra |
15.95 |
| 61 |  Ireland Ireland |
15.89 |
| 62 |  Iceland Iceland |
15.64 |
| 63 |  Georgia Georgia |
15.64 |
| 64 |  Luxembourg Luxembourg |
15.48 |
| 65 |  Thailand Thailand |
15.36 |
| 66 |  China China |
14.67 |
| 67 |  Cyprus Cyprus |
14.62 |
| 68 |  Macao SAR, China Macao SAR, China |
14.27 |
| 69 |  Chile Chile |
14.14 |
| 70 |  Sint Maarten (Dutch part) Sint Maarten (Dutch part) |
13.94 |
| 71 |  Armenia Armenia |
13.70 |
| 72 |  Singapore Singapore |
13.66 |
| 73 |  Mauritius Mauritius |
13.53 |
| 74 |  Dominica Dominica |
12.96 |
| 75 |  Guam Guam |
12.60 |
| 76 |  Israel Israel |
12.55 |
| 77 |  Argentina Argentina |
12.42 |
| 78 |  Korea, Dem. People’s Rep. Korea, Dem. People’s Rep. |
12.40 |
| 79 |  Trinidad and Tobago Trinidad and Tobago |
12.38 |
| 80 |  Grenada Grenada |
12.24 |
| 81 |  Costa Rica Costa Rica |
12.23 |
| 82 |  Sri Lanka Sri Lanka |
12.10 |
| 83 |  St. Vincent and the Grenadines St. Vincent and the Grenadines |
11.89 |
| 84 |  Antigua and Barbuda Antigua and Barbuda |
11.78 |
| 85 |  Bahamas, The Bahamas, The |
11.78 |
| 86 |  New Caledonia New Caledonia |
11.43 |
| 87 |  Palau Palau |
11.34 |
| 88 |  French Polynesia French Polynesia |
11.32 |
| 89 |  Turks and Caicos Islands Turks and Caicos Islands |
11.25 |
| 90 |  St. Kitts and Nevis St. Kitts and Nevis |
11.23 |
| 91 |  Brazil Brazil |
11.05 |
| 92 |  Greenland Greenland |
10.81 |
| 93 |  Turkiye Turkiye |
10.28 |
| 94 |  Lebanon Lebanon |
10.14 |
| 95 |  Kosovo Kosovo |
10.07 |
| 96 |  Colombia Colombia |
9.78 |
| 97 |  Northern Mariana Islands Northern Mariana Islands |
9.75 |
| 98 |  Venezuela Venezuela |
9.68 |
| 99 |  British Virgin Islands British Virgin Islands |
9.62 |
| 100 |  St. Lucia St. Lucia |
9.62 |
| 101 |  Tunisia Tunisia |
9.53 |
| 102 |  Panama Panama |
9.35 |
| 103 |  Peru Peru |
9.23 |
| 104 |  Vietnam Vietnam |
9.05 |
| 105 |  Cayman Islands (UK) Cayman Islands (UK) |
9.00 |
| 106 |  Kazakhstan Kazakhstan |
8.65 |
| 107 |  Azerbaijan Azerbaijan |
8.56 |
| 108 |  Seychelles Seychelles |
8.54 |
| 109 |  Ecuador Ecuador |
8.34 |
| 110 |  Mexico Mexico |
8.25 |
| 111 |  Iran Iran |
8.24 |
| 112 |  Jamaica Jamaica |
8.21 |
| 113 |  El Salvador El Salvador |
8.15 |
| 114 |  Morocco Morocco |
8.14 |
| 115 |  American Samoa American Samoa |
8.04 |
| 116 |  Suriname Suriname |
7.90 |
| 117 |  Dominican Republic Dominican Republic |
7.88 |
| 118 |  Malaysia Malaysia |
7.74 |
| 119 |  Myanmar Myanmar |
7.30 |
| 120 |  Indonesia Indonesia |
7.29 |
| 121 |  India India |
7.15 |
| 122 |  Brunei Darussalam Brunei Darussalam |
6.87 |
| 123 |  Cabo Verde Cabo Verde |
6.86 |
| 124 |  Guyana Guyana |
6.73 |
| 125 |  Tonga Tonga |
6.72 |
| 126 |  South Africa South Africa |
6.69 |
| 127 |  Tuvalu Tuvalu |
6.67 |
| 128 |  Algeria Algeria |
6.58 |
| 129 |  Paraguay Paraguay |
6.54 |
| 130 |  Nepal Nepal |
6.50 |
| 131 |  Bangladesh Bangladesh |
6.50 |
| 132 |  Bhutan Bhutan |
6.49 |
| 133 |  Fiji Fiji |
6.49 |
| 134 |  Cambodia Cambodia |
6.16 |
| 135 |  Micronesia, Fed. Sts. Micronesia, Fed. Sts. |
5.95 |
| 136 |  Samoa Samoa |
5.88 |
| 137 |  Uzbekistan Uzbekistan |
5.86 |
| 138 |  Kyrgyz Republic Kyrgyz Republic |
5.68 |
| 139 |  Bolivia Bolivia |
5.64 |
| 140 |  Nicaragua Nicaragua |
5.53 |
| 141 |  Philippines Philippines |
5.49 |
| 142 |  Timor-Leste Timor-Leste |
5.28 |
| 143 |  Mongolia Mongolia |
5.14 |
| 144 |  Egypt Egypt |
5.12 |
| 145 |  Belize Belize |
5.02 |
| 146 |  Libya Libya |
5.02 |
| 147 |  Djibouti Djibouti |
4.85 |
| 148 |  Guatemala Guatemala |
4.85 |
| 149 |  Syria Syria |
4.74 |
| 150 |  Haiti Haiti |
4.71 |
| 151 |  Laos Laos |
4.67 |
| 152 |  Marshall Islands Marshall Islands |
4.64 |
| 153 |  Maldives Maldives |
4.64 |
| 154 |  Turkmenistan Turkmenistan |
4.53 |
| 155 |  Jordan Jordan |
4.52 |
| 156 |  Comoros Comoros |
4.47 |
| 157 |  Honduras Honduras |
4.42 |
| 158 |  Vanuatu Vanuatu |
4.30 |
| 159 |  Pakistan Pakistan |
4.28 |
| 160 |  Eswatini Eswatini |
4.26 |
| 161 |  Kiribati Kiribati |
4.24 |
| 162 |  Eritrea Eritrea |
4.2 |
| 163 |  Gabon Gabon |
4.08 |
| 164 |  Botswana Botswana |
4.04 |
| 165 |  Rwanda Rwanda |
3.93 |
| 166 |  Sao Tome and Principe Sao Tome and Principe |
3.90 |
| 167 |  Lesotho Lesotho |
3.86 |
| 168 |  Bahrain Bahrain |
3.85 |
| 169 |  Tajikistan Tajikistan |
3.85 |
| 170 |  West Bank and Gaza West Bank and Gaza |
3.84 |
| 171 |  Ghana Ghana |
3.71 |
| 172 |  Equatorial Guinea Equatorial Guinea |
3.69 |
| 173 |  Namibia Namibia |
3.67 |
| 174 |  Solomon Islands Solomon Islands |
3.64 |
| 175 |  Senegal Senegal |
3.62 |
| 176 |  Zimbabwe Zimbabwe |
3.60 |
| 177 |  Papua New Guinea Papua New Guinea |
3.46 |
| 178 |  Guinea Guinea |
3.46 |
| 179 |  Iraq Iraq |
3.41 |
| 180 |  Madagascar Madagascar |
3.41 |
| 181 |  Liberia Liberia |
3.30 |
| 182 |  Sudan Sudan |
3.30 |
| 183 |  Sierra Leone Sierra Leone |
3.24 |
| 184 |  Ethiopia Ethiopia |
3.23 |
| 185 |  Mauritania Mauritania |
3.23 |
| 186 |  Togo Togo |
3.21 |
| 187 |  Guinea-Bissau Guinea-Bissau |
3.19 |
| 188 |  Benin Benin |
3.12 |
| 189 |  Kuwait Kuwait |
3.10 |
| 190 |  Gambia, The Gambia, The |
3.08 |
| 191 |  Congo, Dem. Rep. Congo, Dem. Rep. |
3.08 |
| 192 |  Nigeria Nigeria |
3.05 |
| 193 |  Tanzania Tanzania |
3.05 |
| 194 |  South Sudan South Sudan |
2.99 |
| 195 |  Congo, Rep. Congo, Rep. |
2.99 |
| 196 |  Kenya Kenya |
2.97 |
| 197 |  Saudi Arabia Saudi Arabia |
2.95 |
| 198 |  Angola Angola |
2.85 |
| 199 |  Nauru Nauru |
2.85 |
| 200 |  Cameroon Cameroon |
2.79 |
| 201 |  Mozambique Mozambique |
2.75 |
| 202 |  Burkina Faso Burkina Faso |
2.65 |
| 203 |  Oman Oman |
2.64 |
| 204 |  Cote d’Ivoire Cote d’Ivoire |
2.61 |
| 205 |  Niger Niger |
2.59 |
| 206 |  Somalia Somalia |
2.59 |
| 207 |  Malawi Malawi |
2.59 |
| 208 |  Burundi Burundi |
2.53 |
| 209 |  Yemen Yemen |
2.52 |
| 210 |  Afghanistan Afghanistan |
2.40 |
| 211 |  Mali Mali |
2.38 |
| 212 |  Uganda Uganda |
2.19 |
| 213 |  Central African Republic Central African Republic |
2.15 |
| 214 |  Chad Chad |
2.10 |
| 215 |  Zambia Zambia |
1.95 |
| 216 |  United Arab Emirates United Arab Emirates |
1.77 |
| 217 |  Qatar Qatar |
1.68 |
Monaco is a clear outlier, with more than one in three residents aged 65 or older.
Japan follows at nearly 30%, while Southern and Eastern Europe account for much of the rest of the top 15. Together, these rankings show how population aging has become concentrated in advanced economies with decades of low fertility and long life expectancy.
Europe Dominates the Aging Rankings
Europe’s high senior shares reflect decades of below-replacement fertility and rising life expectancy. Countries such as Italy, Portugal, Greece, and Germany now have more than one in five residents aged 65 or older, making Europe the world’s oldest region by this measure.
Outside Europe, smaller territories and economies including Puerto Rico, the U.S. Virgin Islands, Hong Kong, and San Marino also rank near the top.
The Workforce Impact
As populations age, the balance between workers and retirees shifts. A smaller working-age population can slow economic growth while increasing demand for pensions, healthcare, and long-term care.
These demographic changes are already reshaping labor markets in many countries, encouraging employers to retain older workers, automate routine tasks, and find new ways to address labor shortages.
Learn More on the Voronoi App 
To see how aging trends could evolve over the rest of the century, check out Ranked: Top 25 Countries With the Most Seniors in 2025, 2050, 2075, & 2100 on Voronoi.
Changes made