Where Groceries Cost the Most–and Least–in America
Key Takeaways
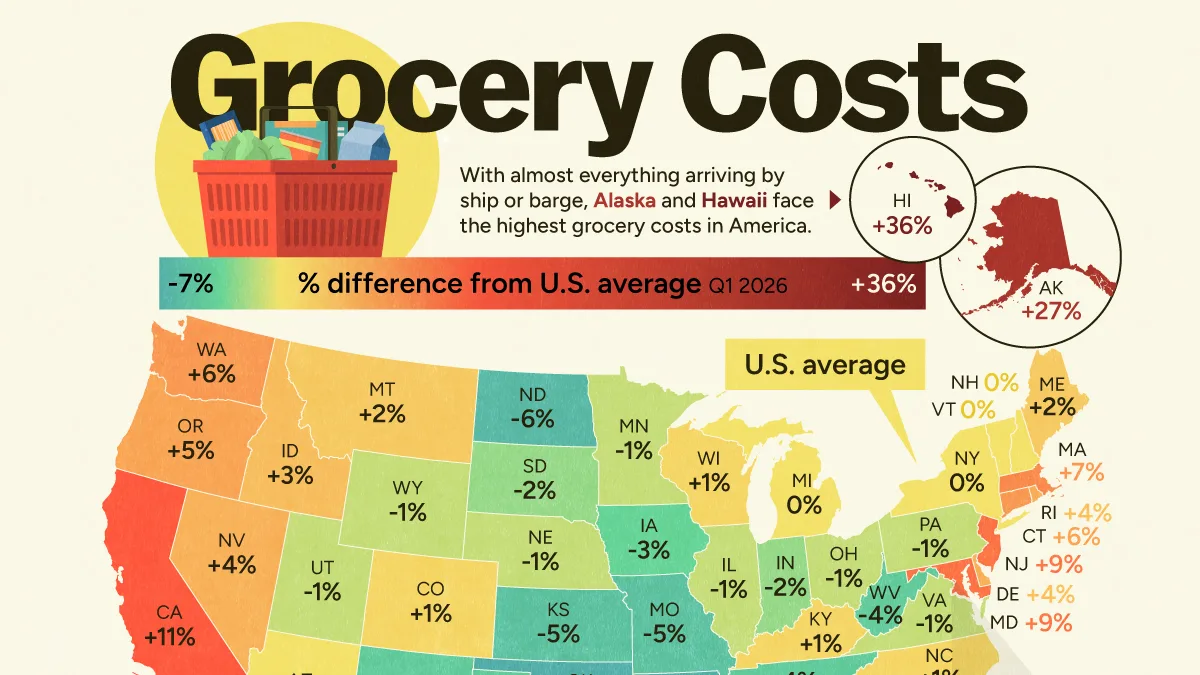
- Hawaii has the highest grocery costs in the U.S., at 36.3% above the national average, followed by Alaska at 26.6%.
- California is the most expensive state for groceries in the contiguous U.S., at 10.5% above average.
- Mississippi has the lowest grocery costs, at 6.8% below the national average.
How much more, or less, does a typical basket of groceries cost in your state?
This map compares grocery costs across all 50 states and Washington, D.C., in the first quarter of 2026, using data from the Missouri Economic Research and Information Center (MERIC). Its grocery index measures the cost of a fixed basket of supermarket goods, with 100 representing the U.S. average.
Why Hawaii and Alaska Stand So Far Above the Rest
Hawaii has by far the highest grocery index, at 136.3, meaning its basket costs 36.3% more than the national average. Alaska ranks second at 126.6, or 26.6% above average.
Both states face unusual geographic and logistical challenges. Much of their food must travel long distances by ship, barge, or air before reaching store shelves, making transportation costs a bigger factor than in the contiguous U.S. Those costs can also be affected by changes in fuel prices.
The table below shows the grocery index for all 50 states and Washington, D.C., along with the difference from the U.S. benchmark of 100 in index points:
| Rank | State | Grocery Cost Index (U.S. = 100) |
|---|---|---|
| 1 | Hawaii | 136.3 |
| 2 | Alaska | 126.6 |
| 3 | California | 110.5 |
| 4 | Maryland | 109.3 |
| 5 | District of Columbia | 109.2 |
| 6 | New Jersey | 109.1 |
| 7 | Massachusetts | 106.8 |
| 8 | Washington | 106.1 |
| 9 | Connecticut | 106 |
| 10 | Florida | 105.7 |
| 11 | Oregon | 104.5 |
| 12 | Nevada | 103.8 |
| 12 | Rhode Island | 103.8 |
| 14 | Delaware | 103.6 |
| 15 | Idaho | 103.4 |
| 16 | Montana | 102.4 |
| 17 | Maine | 101.6 |
| 18 | Kentucky | 101.4 |
| 19 | Colorado | 100.9 |
| 19 | Wisconsin | 100.9 |
| 21 | North Carolina | 100.8 |
| 22 | New York | 100.3 |
| 23 | Michigan | 100.1 |
| 24 | New Hampshire | 100 |
| 25 | Arizona | 99.6 |
| 25 | Vermont | 99.6 |
| 27 | Nebraska | 99.5 |
| 28 | Virginia | 99.3 |
| 29 | Illinois | 99.2 |
| 30 | Pennsylvania | 99 |
| 31 | Ohio | 98.9 |
| 31 | Wyoming | 98.9 |
| 33 | Minnesota | 98.8 |
| 34 | South Carolina | 98.6 |
| 34 | Utah | 98.6 |
| 36 | Indiana | 97.9 |
| 37 | South Dakota | 97.6 |
| 38 | Georgia | 96.9 |
| 39 | Iowa | 96.6 |
| 40 | West Virginia | 96.2 |
| 41 | New Mexico | 96 |
| 42 | Texas | 95.9 |
| 43 | Tennessee | 95.8 |
| 44 | Louisiana | 95.4 |
| 45 | Kansas | 95.3 |
| 46 | Alabama | 95 |
| 47 | Missouri | 94.7 |
| 48 | North Dakota | 94.1 |
| 49 | Oklahoma | 93.5 |
| 50 | Arkansas | 93.4 |
| 51 | Mississippi | 93.2 |
The biggest drop comes after the top two. California ranks third, but its grocery costs are only 10.5% above the national average, less than half Alaska’s premium.
Across the contiguous U.S., a regional pattern still emerges: much of the West Coast and Northeast sits above average, while many Southern and Plains states fall below it.
The pattern is not simply a matter of distance from farms. The priciest states include California and Florida, which grow a significant share of America’s produce.
Store operating costs can also play a role. Higher wages and commercial real estate costs can push prices upward in expensive coastal markets, while lower operating costs and greater competition from discount grocers can help keep prices down in parts of the South and Plains.
New York Shows the Grocery Disconnect in Living Costs
New York provides one of the clearest examples of how grocery costs can diverge from the broader cost of living. Its overall cost-of-living index is 124.7, ranking sixth-highest in the country, yet its grocery index is almost exactly at the national average at 100.3.
Massachusetts offers another example. Its overall index is 147.8, the second-highest in the country, while its grocery costs are only 6.8% above average.
The data table below shows how each state compares across all six C2ER spending categories in the cost-of-living index:
| State | Cost of Living Index by Category, Q1 2026 (U.S. = 100) | ||||||
|---|---|---|---|---|---|---|---|
| Overall | Grocery | Housing | Utilities | Transportation | Health | Misc. | |
| Alabama | 85.0 | 95.0 | 67.7 | 96.9 | 88.8 | 85.6 | 91.8 |
| Alaska | 129.0 | 126.6 | 132.4 | 148.4 | 123.8 | 130.7 | 123.1 |
| Arizona | 107.6 | 99.6 | 119.0 | 102.1 | 103.5 | 98.8 | 104.9 |
| Arkansas | 89.1 | 93.4 | 77.2 | 98.3 | 88.8 | 85.8 | 95.7 |
| California | 140.5 | 110.5 | 189.5 | 134.6 | 142.0 | 111.1 | 116.0 |
| Colorado | 101.8 | 100.9 | 107.4 | 88.7 | 89.1 | 103.9 | 103.5 |
| Connecticut | 114.2 | 106.0 | 123.5 | 126.5 | 105.6 | 108.9 | 109.6 |
| Delaware | 101.7 | 103.6 | 101.3 | 97.5 | 99.6 | 101.6 | 102.9 |
| District of Columbia | 134.3 | 109.2 | 190.4 | 107.8 | 105.8 | 118.7 | 112.4 |
| Florida | 100.7 | 105.7 | 101.1 | 94.6 | 99.5 | 101.4 | 99.8 |
| Georgia | 90.6 | 96.9 | 77.6 | 98.6 | 96.3 | 99.6 | 94.3 |
| Hawaii | 184.8 | 136.3 | 302.4 | 183.5 | 149.0 | 113.1 | 122.7 |
| Idaho | 101.7 | 103.4 | 105.1 | 73.4 | 101.0 | 101.6 | 105.3 |
| Illinois | 95.1 | 99.2 | 84.7 | 102.6 | 97.0 | 103.0 | 98.9 |
| Indiana | 88.3 | 97.9 | 73.0 | 95.2 | 95.7 | 91.5 | 93.5 |
| Iowa | 88.6 | 96.6 | 75.6 | 88.6 | 93.7 | 94.3 | 94.5 |
| Kansas | 87.6 | 95.3 | 77.5 | 97.4 | 88.0 | 90.6 | 90.1 |
| Kentucky | 92.5 | 101.4 | 78.1 | 87.8 | 95.8 | 92.4 | 101.6 |
| Louisiana | 91.1 | 95.4 | 83.3 | 82.3 | 94.4 | 91.6 | 97.3 |
| Maine | 114.6 | 101.6 | 134.8 | 124.6 | 104.4 | 114.7 | 102.7 |
| Maryland | 121.1 | 109.3 | 149.1 | 113.2 | 106.3 | 106.9 | 109.5 |
| Massachusetts | 147.8 | 106.8 | 217.5 | 143.9 | 108.5 | 131.8 | 118.3 |
| Michigan | 93.9 | 100.1 | 85.7 | 98.0 | 98.5 | 88.2 | 97.0 |
| Minnesota | 93.4 | 98.8 | 79.5 | 95.4 | 93.6 | 111.5 | 100.0 |
| Mississippi | 86.2 | 93.2 | 71.0 | 94.4 | 89.8 | 85.1 | 93.7 |
| Missouri | 88.6 | 94.7 | 76.1 | 92.4 | 86.5 | 98.0 | 95.2 |
| Montana | 105.9 | 102.4 | 113.2 | 80.2 | 103.9 | 106.3 | 108.0 |
| Nebraska | 91.3 | 99.5 | 78.1 | 92.1 | 87.4 | 105.6 | 97.9 |
| Nevada | 100.7 | 103.8 | 110.5 | 81.3 | 115.6 | 105.4 | 91.1 |
| New Hampshire | 110.1 | 100.0 | 116.5 | 116.4 | 106.0 | 106.5 | 108.8 |
| New Jersey | 118.8 | 109.1 | 144.3 | 110.3 | 103.8 | 115.8 | 107.0 |
| New Mexico | 89.9 | 96.0 | 83.2 | 80.0 | 89.5 | 101.9 | 94.0 |
| New York | 124.7 | 100.3 | 172.3 | 102.2 | 111.5 | 108.9 | 104.9 |
| North Carolina | 96.6 | 100.8 | 91.7 | 94.3 | 92.3 | 108.4 | 99.2 |
| North Dakota | 90.7 | 94.1 | 77.2 | 86.4 | 96.7 | 107.7 | 98.3 |
| Ohio | 93.7 | 98.9 | 86.3 | 100.9 | 92.7 | 96.5 | 96.0 |
| Oklahoma | 83.5 | 93.5 | 66.9 | 94.5 | 83.7 | 98.1 | 88.8 |
| Oregon | 109.6 | 104.5 | 117.4 | 96.3 | 115.4 | 115.3 | 106.1 |
| Pennsylvania | 96.2 | 99.0 | 84.1 | 108.4 | 104.2 | 95.1 | 100.5 |
| Rhode Island | 111.2 | 103.8 | 114.4 | 122.3 | 103.1 | 104.1 | 111.9 |
| South Carolina | 91.9 | 98.6 | 79.8 | 95.1 | 94.6 | 97.6 | 97.3 |
| South Dakota | 94.1 | 97.6 | 88.2 | 85.4 | 100.1 | 104.1 | 96.9 |
| Tennessee | 88.9 | 95.8 | 80.3 | 84.5 | 87.2 | 88.7 | 95.0 |
| Texas | 90.7 | 95.9 | 77.7 | 104.0 | 90.9 | 96.8 | 95.6 |
| Utah | 100.6 | 98.6 | 110.8 | 84.4 | 96.2 | 89.9 | 99.2 |
| Vermont | 113.0 | 99.6 | 127.5 | 112.0 | 109.0 | 108.2 | 108.2 |
| Virginia | 99.1 | 99.3 | 99.1 | 99.5 | 98.0 | 96.9 | 99.6 |
| Washington | 114.6 | 106.1 | 123.1 | 99.4 | 131.2 | 110.3 | 111.0 |
| West Virginia | 87.9 | 96.2 | 71.3 | 90.4 | 99.5 | 89.5 | 94.9 |
| Wisconsin | 97.4 | 100.9 | 96.6 | 96.0 | 89.8 | 105.3 | 97.7 |
| Wyoming | 93.7 | 98.9 | 86.5 | 92.4 | 87.7 | 97.0 | 99.3 |
The difference comes down in part to which expenses rise the most in high-cost places. Housing carries the largest weight in the overall cost-of-living index and can run two or three times the national average in the priciest metros. Grocery prices tend to vary within a much narrower range.
Groceries also benefit from scale and competition. Dense states such as New York and Massachusetts can support large numbers of stores and national chains, helping keep grocery prices closer to average even when housing and other expenses are far higher.
Learn More on the Voronoi App
If you enjoyed today’s post, check out Mapped: Every U.S. State’s Economy, Matched to a Country on Voronoi.