Mapped: People Are Closer on Climate Than They Think
Climate action often depends on whether people believe others share their concern. However, new survey data suggests many societies may underestimate public support for treating climate change as serious.
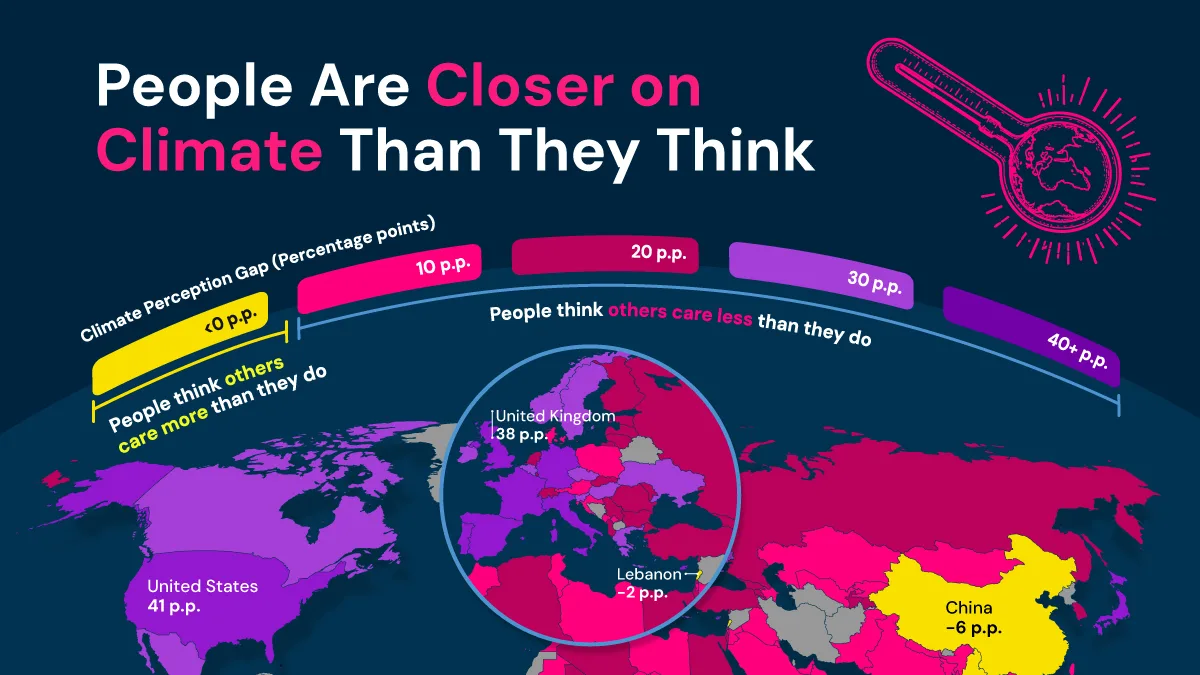
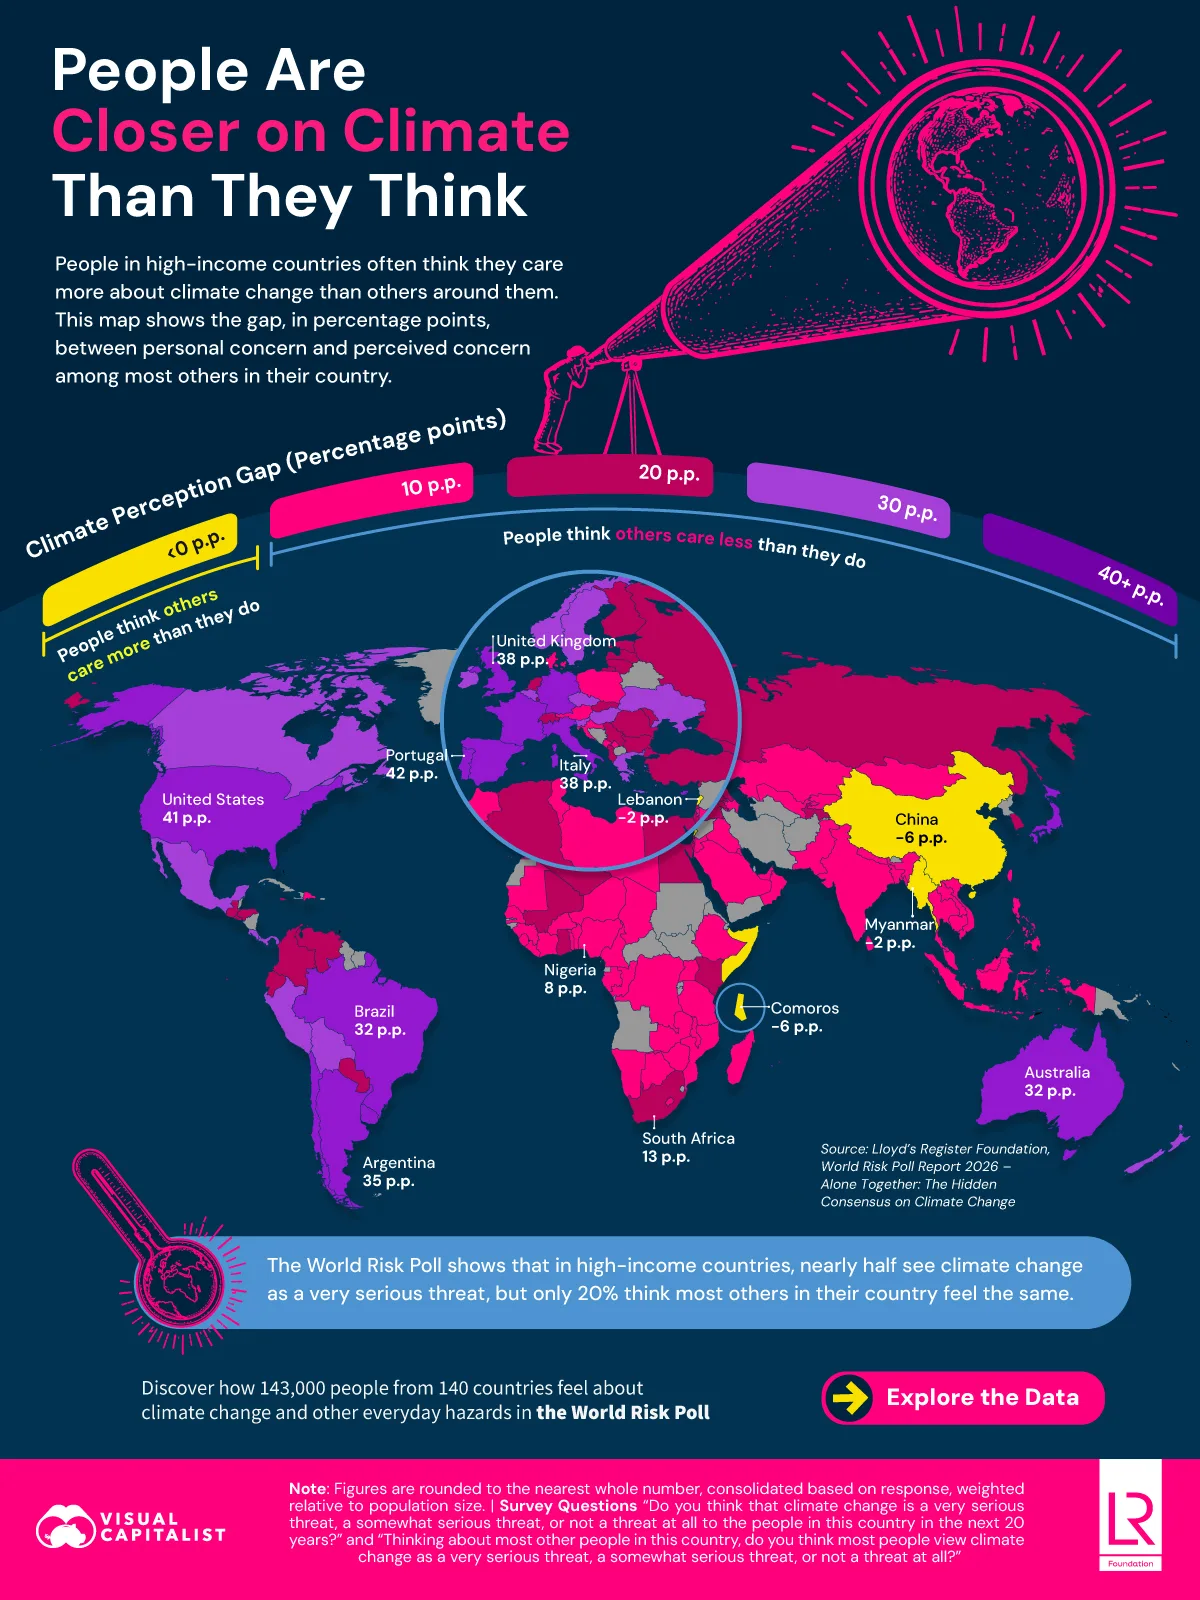
This graphic, in partnership with Lloyd’s Register Foundation, shows the gap between personal climate concern and perceived concern among most others using data from World Risk Poll Report 2026.
Climate Concern Is More Shared Than It Looks
The climate perception gap measures how much personal concern exceeds perceived concern among fellow citizens. In many countries, the difference is positive, meaning people care more than they think others do.
Here is a table that shows the climate perception gap by country.
| Rank | Country | Climate Change is a Very Serious Threat to the Country in Next 20 Years (%) | Most Other People in (Country) View Climate Change as a Very Serious Threat to the Country in Next 20 Years (%) | Climate Perception Gap (percentage points) |
|---|---|---|---|---|
| 1 |  Portugal Portugal |
66 | 24 | 42 |
| 2 |  United States United States |
51 | 10 | 41 |
| 3 |  Italy Italy |
58 | 20 | 38 |
| 4 |  United Kingdom United Kingdom |
53 | 15 | 38 |
| 5 |  Uruguay Uruguay |
63 | 26 | 36 |
| 6 |  Spain Spain |
63 | 26 | 36 |
| 7 |  Argentina Argentina |
61 | 25 | 35 |
| 8 |  France France |
49 | 14 | 35 |
| 9 |  Germany Germany |
63 | 29 | 34 |
| 10 |  Chile Chile |
69 | 36 | 34 |
| 11 |  Brazil Brazil |
70 | 38 | 32 |
| 12 |  Cyprus Cyprus |
60 | 28 | 32 |
| 13 |  Australia Australia |
47 | 15 | 32 |
| 14 |  Japan Japan |
54 | 23 | 31 |
| 15 |  Ireland Ireland |
53 | 23 | 30 |
| 16 |  Greece Greece |
62 | 33 | 29 |
| 17 |  Slovenia Slovenia |
47 | 18 | 28 |
| 18 |  Sweden Sweden |
42 | 13 | 29 |
| 19 |  Hungary Hungary |
58 | 30 | 28 |
| 20 |  Costa Rica Costa Rica |
76 | 49 | 27 |
| 21 |  Mexico Mexico |
65 | 38 | 27 |
| 22 |  Canada Canada |
46 | 19 | 27 |
| 23 |  Peru Peru |
64 | 39 | 25 |
| 24 |  Ukraine Ukraine |
46 | 21 | 25 |
| 25 |  Panama Panama |
72 | 48 | 24 |
| 26 |  Norway Norway |
35 | 11 | 23 |
| 27 |  Singapore Singapore |
41 | 18 | 23 |
| 28 |  New Zealand New Zealand |
37 | 14 | 23 |
| 29 |  Belgium Belgium |
36 | 13 | 23 |
| 30 |  Czech Republic Czech Republic |
32 | 9 | 24 |
| 31 |  Bolivia Bolivia |
60 | 38 | 23 |
| 32 |  Malta Malta |
47 | 26 | 21 |
| 33 |  Jamaica Jamaica |
45 | 25 | 19 |
| 34 |  Mauritius Mauritius |
41 | 21 | 21 |
| 35 |  Bulgaria Bulgaria |
52 | 33 | 19 |
| 36 |  Serbia Serbia |
44 | 25 | 20 |
| 37 |  Iceland Iceland |
23 | 4 | 19 |
| 38 |  Colombia Colombia |
71 | 53 | 18 |
| 39 |  Georgia Georgia |
67 | 49 | 17 |
| 40 |  Romania Romania |
58 | 40 | 18 |
| 41 |  Armenia Armenia |
37 | 19 | 18 |
| 42 |  Finland Finland |
28 | 10 | 18 |
| 43 |  Ecuador Ecuador |
63 | 46 | 17 |
| 44 |  Honduras Honduras |
62 | 45 | 17 |
| 45 |  Turkey Turkey |
58 | 41 | 18 |
| 46 |  Venezuela Venezuela |
55 | 38 | 17 |
| 47 |  Paraguay Paraguay |
54 | 37 | 17 |
| 48 |  Switzerland Switzerland |
53 | 36 | 17 |
| 49 |  Netherlands Netherlands |
28 | 11 | 17 |
| 50 |  Albania Albania |
59 | 45 | 13 |
| 51 |  Russia Russia |
30 | 16 | 14 |
| 52 |  Ghana Ghana |
57 | 44 | 14 |
| 53 |  South Africa South Africa |
49 | 36 | 13 |
| 54 |  Taiwan Taiwan |
46 | 33 | 13 |
| 55 |  Slovakia Slovakia |
39 | 26 | 13 |
| 56 |  Israel Israel |
37 | 24 | 13 |
| 57 |  Latvia Latvia |
33 | 20 | 13 |
| 58 |  Kenya Kenya |
59 | 47 | 12 |
| 59 |  El Salvador El Salvador |
51 | 39 | 12 |
| 60 |  Bosnia Herzegovina Bosnia Herzegovina |
44 | 32 | 12 |
| 61 |  Moldova Moldova |
42 | 30 | 12 |
| 62 |  Egypt Egypt |
31 | 19 | 12 |
| 63 |  South Korea South Korea |
64 | 53 | 12 |
| 64 |  Guatemala Guatemala |
55 | 44 | 11 |
| 65 |  Tajikistan Tajikistan |
54 | 43 | 12 |
| 66 |  Luxembourg Luxembourg |
52 | 41 | 11 |
| 67 |  Algeria Algeria |
37 | 26 | 11 |
| 68 |  Lithuania Lithuania |
27 | 16 | 11 |
| 69 |  Guinea Guinea |
62 | 52 | 10 |
| 70 |  Austria Austria |
61 | 51 | 10 |
| 71 |  Zambia Zambia |
60 | 50 | 10 |
| 72 |  Gambia Gambia |
52 | 42 | 11 |
| 73 |  Uganda Uganda |
50 | 40 | 9 |
| 74 |  Cameroon Cameroon |
45 | 35 | 10 |
| 75 |  Mali Mali |
42 | 32 | 11 |
| 76 |  Estonia Estonia |
17 | 7 | 10 |
| 77 |  Lesotho Lesotho |
58 | 49 | 9 |
| 78 |  Sierra Leone Sierra Leone |
56 | 47 | 9 |
| 79 |  Botswana Botswana |
55 | 46 | 9 |
| 80 |  Liberia Liberia |
53 | 44 | 9 |
| 81 |  Burkina Faso Burkina Faso |
50 | 41 | 9 |
| 82 |  Senegal Senegal |
49 | 40 | 10 |
| 83 |  Kosovo Kosovo |
42 | 33 | 9 |
| 84 |  Gabon Gabon |
40 | 31 | 8 |
| 85 |  Morocco Morocco |
33 | 24 | 9 |
| 86 |  Tunisia Tunisia |
30 | 21 | 9 |
| 87 |  Montenegro Montenegro |
27 | 18 | 9 |
| 88 |  United Arab Emirates United Arab Emirates |
27 | 18 | 9 |
| 89 |  Malawi Malawi |
86 | 78 | 8 |
| 90 |  Philippines Philippines |
61 | 53 | 8 |
| 91 |  North Macedonia North Macedonia |
60 | 52 | 8 |
| 92 |  Nigeria Nigeria |
43 | 35 | 8 |
| 93 |  Jordan Jordan |
30 | 22 | 8 |
| 94 |  Hong Kong Hong Kong |
26 | 18 | 8 |
| 95 |  Palestine Palestine |
25 | 17 | 8 |
| 96 |  Vietnam Vietnam |
72 | 65 | 6 |
| 97 |  Iraq Iraq |
38 | 31 | 7 |
| 98 |  Indonesia Indonesia |
36 | 29 | 7 |
| 99 |  Bahrain Bahrain |
30 | 23 | 7 |
| 100 |  Kuwait Kuwait |
16 | 9 | 7 |
| 101 |  Zimbabwe Zimbabwe |
54 | 48 | 5 |
| 102 |  Pakistan Pakistan |
49 | 43 | 7 |
| 103 |  Azerbaijan Azerbaijan |
44 | 38 | 6 |
| 104 |  Kyrgyzstan Kyrgyzstan |
42 | 36 | 6 |
| 105 |  Kazakhstan Kazakhstan |
40 | 34 | 6 |
| 106 |  Poland Poland |
39 | 33 | 7 |
| 107 |  Malaysia Malaysia |
34 | 28 | 6 |
| 108 |  Croatia Croatia |
25 | 19 | 7 |
| 109 |  Mozambique Mozambique |
52 | 47 | 5 |
| 110 |  Sri Lanka Sri Lanka |
29 | 24 | 4 |
| 111 |  Benin Benin |
57 | 53 | 3 |
| 112 |  Togo Togo |
53 | 49 | 4 |
| 113 |  Ivory Coast Ivory Coast |
48 | 44 | 4 |
| 114 |  Thailand Thailand |
44 | 40 | 4 |
| 115 |  Dominican Republic Dominican Republic |
42 | 38 | 4 |
| 116 |  Mauritania Mauritania |
40 | 36 | 4 |
| 117 |  Congo Kinshasa Congo Kinshasa |
32 | 28 | 4 |
| 118 |  Saudi Arabia Saudi Arabia |
11 | 7 | 4 |
| 119 |  Nepal Nepal |
49 | 46 | 3 |
| 120 |  Tanzania Tanzania |
48 | 45 | 3 |
| 121 |  Denmark Denmark |
27 | 24 | 3 |
| 122 |  Libya Libya |
25 | 22 | 4 |
| 123 |  Oman Oman |
16 | 13 | 3 |
| 124 |  Madagascar Madagascar |
63 | 61 | 2 |
| 125 |  Bangladesh Bangladesh |
44 | 42 | 3 |
| 126 |  Niger Niger |
44 | 42 | 2 |
| 127 |  Congo Brazzaville Congo Brazzaville |
43 | 41 | 2 |
| 128 |  Mongolia Mongolia |
36 | 34 | 2 |
| 129 |  India India |
33 | 31 | 2 |
| 130 |  Laos Laos |
31 | 29 | 2 |
| 131 |  Cambodia Cambodia |
29 | 27 | 3 |
| 132 |  Chad Chad |
50 | 49 | 2 |
| 133 |  Uzbekistan Uzbekistan |
44 | 43 | 1 |
| 134 |  Namibia Namibia |
32 | 31 | 1 |
| 135 |  Ethiopia Ethiopia |
16 | 15 | 1 |
| 136 |  Somalia Somalia |
28 | 29 | 0 |
| 137 |  Lebanon Lebanon |
39 | 41 | -2 |
| 138 |  Myanmar Myanmar |
19 | 21 | -2 |
| 139 |  Comoros Comoros |
34 | 40 | -6 |
| 140 |  China China |
23 | 29 | -6 |
Portugal and the United States top the ranking, with gaps above 41 percentage points. Italy and the UK follow, both near 38 points.
Only a handful of countries yield the opposite result, including Somalia, Lebanon, Myanmar, Comoros, and China.
The Largest Gaps Are in Wealthier Countries
High-income countries account for 25 of the top 30 gaps. As a result, the biggest story is not apathy, but a misread of social concern.
Nearly half of people in high-income countries see climate change as very serious. Yet only 20% think most others in their country feel the same.
A Silver Lining for Climate Action
This misperception can matter because people often take cues from those around them. Therefore, correcting the gap could make climate concern feel more mainstream.
That makes the finding a potential silver lining. In high-income countries, people may be closer on climate than public debate suggests.
Meanwhile, climate risk continues to shape the global risk landscape, especially as extreme weather influences economies and policy.

Explore the 2026 World Risk Poll Report
-
 Water6 months ago
Special Report: 8,500 Toxic Shipwrecks. Zero Global Framework.
Shipwrecks from past wars threaten oceans with oil leaks and toxic hazards. What can leaders do to help endangered ecosystems and coastal nations?
-
 Environment2 years ago
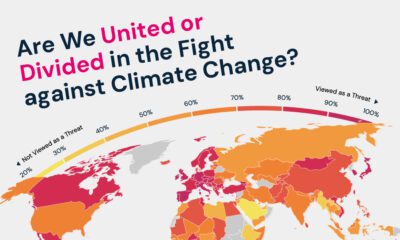
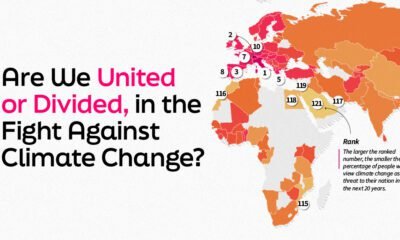
Are We United or Divided in The Fight Against Climate Change?
Visual Capitalist partnered with Lloyd’s Register Foundation to determine which nations believe climate change is a threat.
-
 Business2 years ago
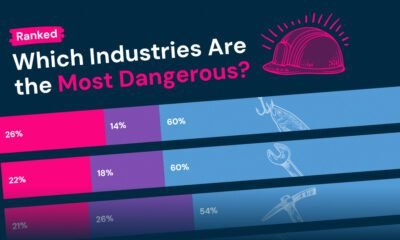
Ranked: Which Industries Are the Most Dangerous?
In this graphic, Visual Capitalist partnered with Lloyd’s Register Foundation to analyze workplace safety and determine the most dangerous industry.
-
 Environment2 years ago
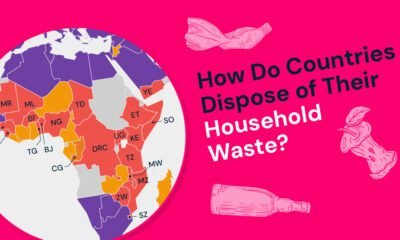
Visualized: How Do Countries Dispose of Their Household Waste?
In this graphic, Visual Capitalist has partnered with Lloyd’s Register Foundation to explore the most common household waste disposal practices in 142 countries.
-
 Money2 years ago
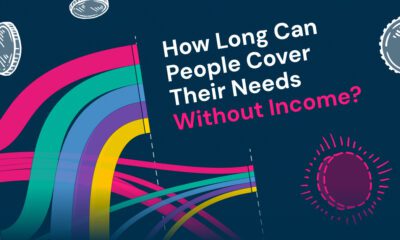
Visualized: How Long Can Each Generation Survive Without Income?
Visual Capitalist has partnered with Lloyd’s Register Foundation to explore how long each generation can cover their needs without income.
-
 Green3 years ago
World Risk Poll: How Do People Feel About Climate Change?
This graphic explores 121 nations thoughts on climate change and ranks them by the volume of their population who views it as a threat.
-
 Economy3 years ago
World Risk Poll: How Long Can People Survive Without Income?
Income security is critical in resilience. In this graphic, we explore how secure people are and how long they could live without income.
-
 Misc3 years ago
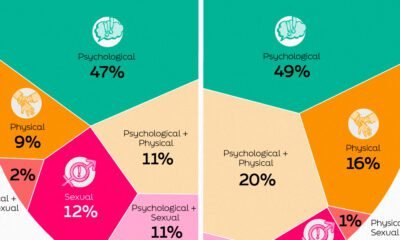
World Risk Poll: Visualizing Harassment and Violence in the Workplace
This infographic shows the types of workplace violence and harassment faced by people in the global workplace.
-
 Technology3 years ago
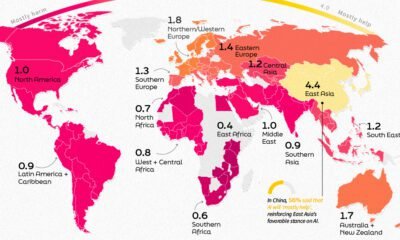
World Risk Poll: Mapping Global Sentiment on AI
This infographic shows public perception of AI all over the globe and how this sentiment is affected by where you live.