 See this visualization first on the Voronoi app.
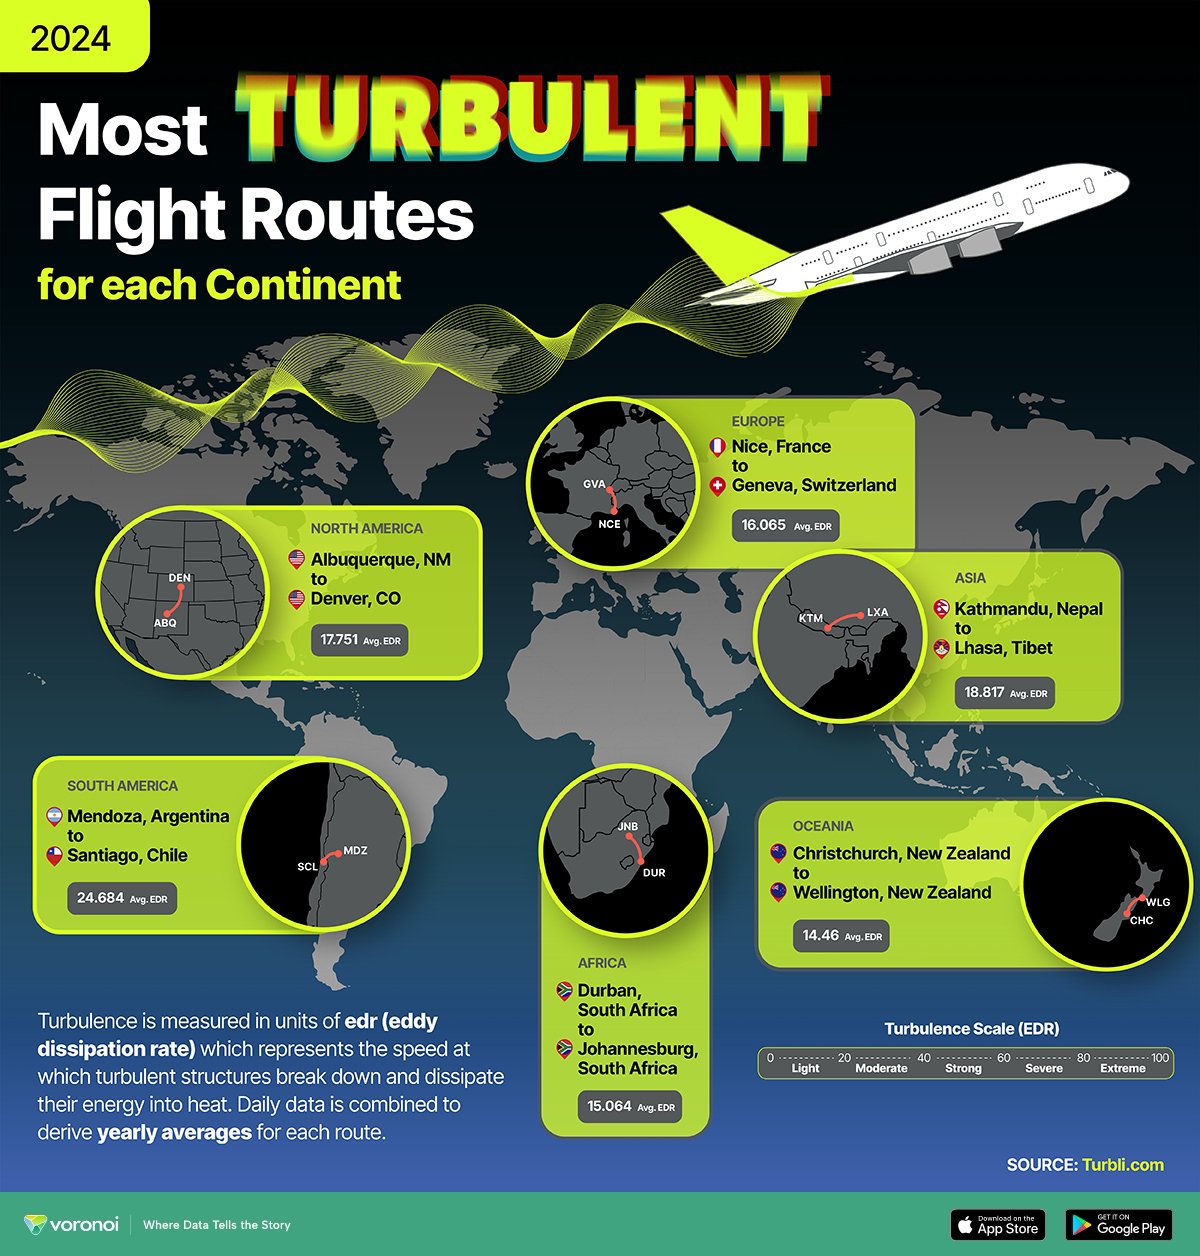
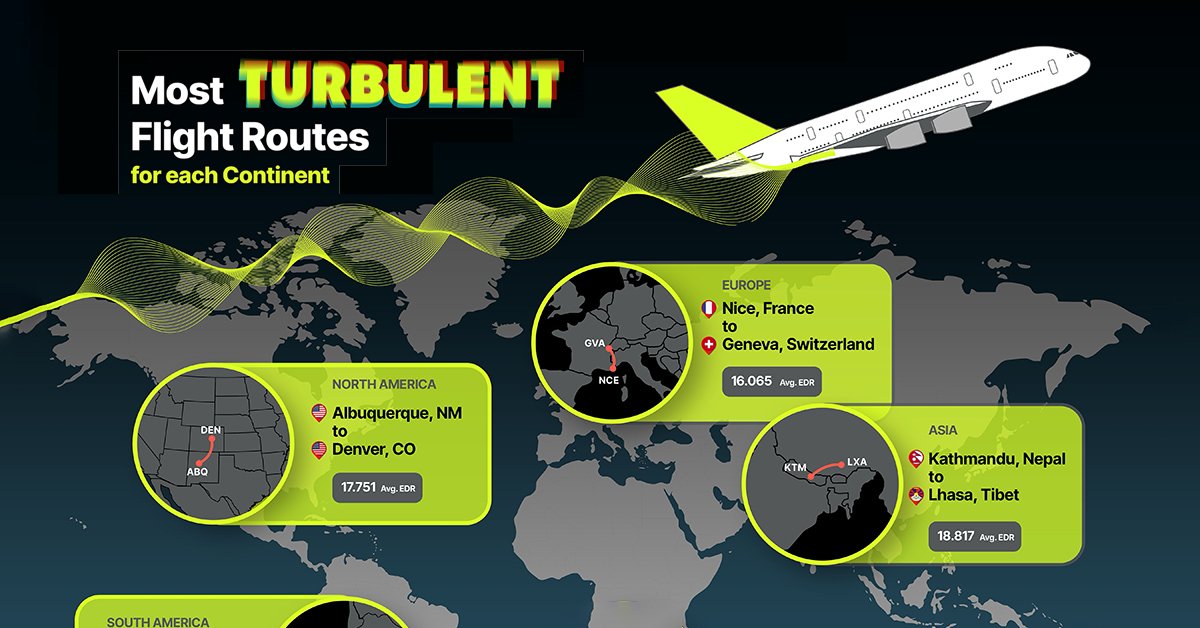
Mapped: The Most Turbulent Flight Routes
This was originally posted on our Voronoi app. Download the app for free on iOS or Android and discover incredible data-driven charts from a variety of trusted sources.
- South America’s Mendoza–Santiago route tops the global list, with other bumpy corridors crossing the Rockies, Himalayas, Alps, and New Zealand’s Cook Strait.
- “EDR” (eddy dissipation rate) is the aircraft-independent metric used to quantify turbulence intensity along a route.
- Clear-air turbulence is trending upward globally as warming strengthens wind shear in jet streams, making rough air more common.
The visual above, created by Julie Peasley, maps the single most turbulent flight route on each continent using Turbli’s 2024 rankings. Turbli compiles daily turbulence along actual flight tracks and reports average intensity using the eddy dissipation rate (EDR) scale from 0 to 100 (light to extreme).
| Rank | Top route for each continent | Average turbulence (edr) | Cities |
|---|---|---|---|
| 1 | MDZ → SCL | 24.68 |  Mendoza → Mendoza →  Santiago Santiago |
| 2 | KTM → LXA | 18.82 |  Kathmandu → Kathmandu →  Lhasa Lhasa |
| 3 | ABQ → DEN | 17.75 |  Albuquerque → Denver Albuquerque → Denver |
| 4 | NCE → GVA | 16.07 |  Nice → Nice →  Geneva Geneva |
| 5 | DUR → JNB | 15.06 |  Durban → Johannesburg Durban → Johannesburg |
| 6 | CHC → WLG | 14.46 |  Christchurch → Wellington Christchurch → Wellington |
South America’s Mendoza (MDZ)–Santiago (SCL) tops the chart at 24.684 average EDR, followed by mountain-hugging routes such as Kathmandu–Lhasa, Albuquerque–Denver, and Christchurch–Wellington. Interestingly, SCL has the distinction of being the world’s most turbulent airport. Europe’s Nice–Geneva and Africa’s Durban–Johannesburg also make the list.
What the Data Shows
Several of the bumpiest routes trace over or alongside major mountain chains—the Andes, Himalayas, Alps, and Southern Alps—where strong winds can generate mountain waves, rotors, and turbulent shear. Island-to-island or strait crossings (e.g., Wellington) also see rough air as winds accelerate through gaps.
Why Turbulence Is Rising
A growing body of research points to more frequent clear-air turbulence (CAT), driven by climate change. Warmer air intensifies wind shear in jet streams; over the North Atlantic, the annual duration of severe CAT increased about 55% between 1979 and 2020, with notable rises across other busy regions as well.
EDR: The Standard for “How Bumpy”
EDR is an objective, aircraft-independent measure of turbulence intensity and the ICAO/WMO standard used in aviation. NCAR and partners compute EDR from onboard parameters to create consistent, comparable reports, which is exactly the kind of metric Turbli aggregates for its rankings.
What This Means for Flyers
Rougher skies don’t mean flying is unsafe. Modern aircraft are designed for turbulence, and injuries are rare when seat belts are fastened. For broader context on risk, see our chart on air travel fatalities per million passengers.
Learn More on the Voronoi App
Explore more aviation data, including Longest Flights of the World, on Voronoi.