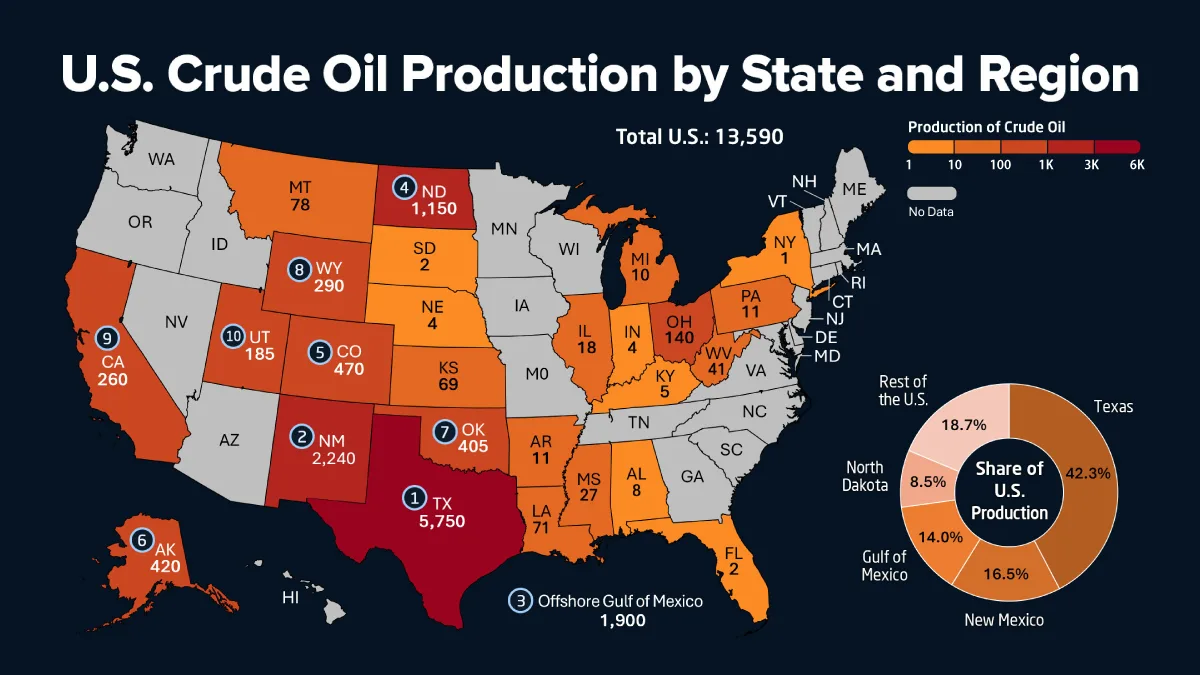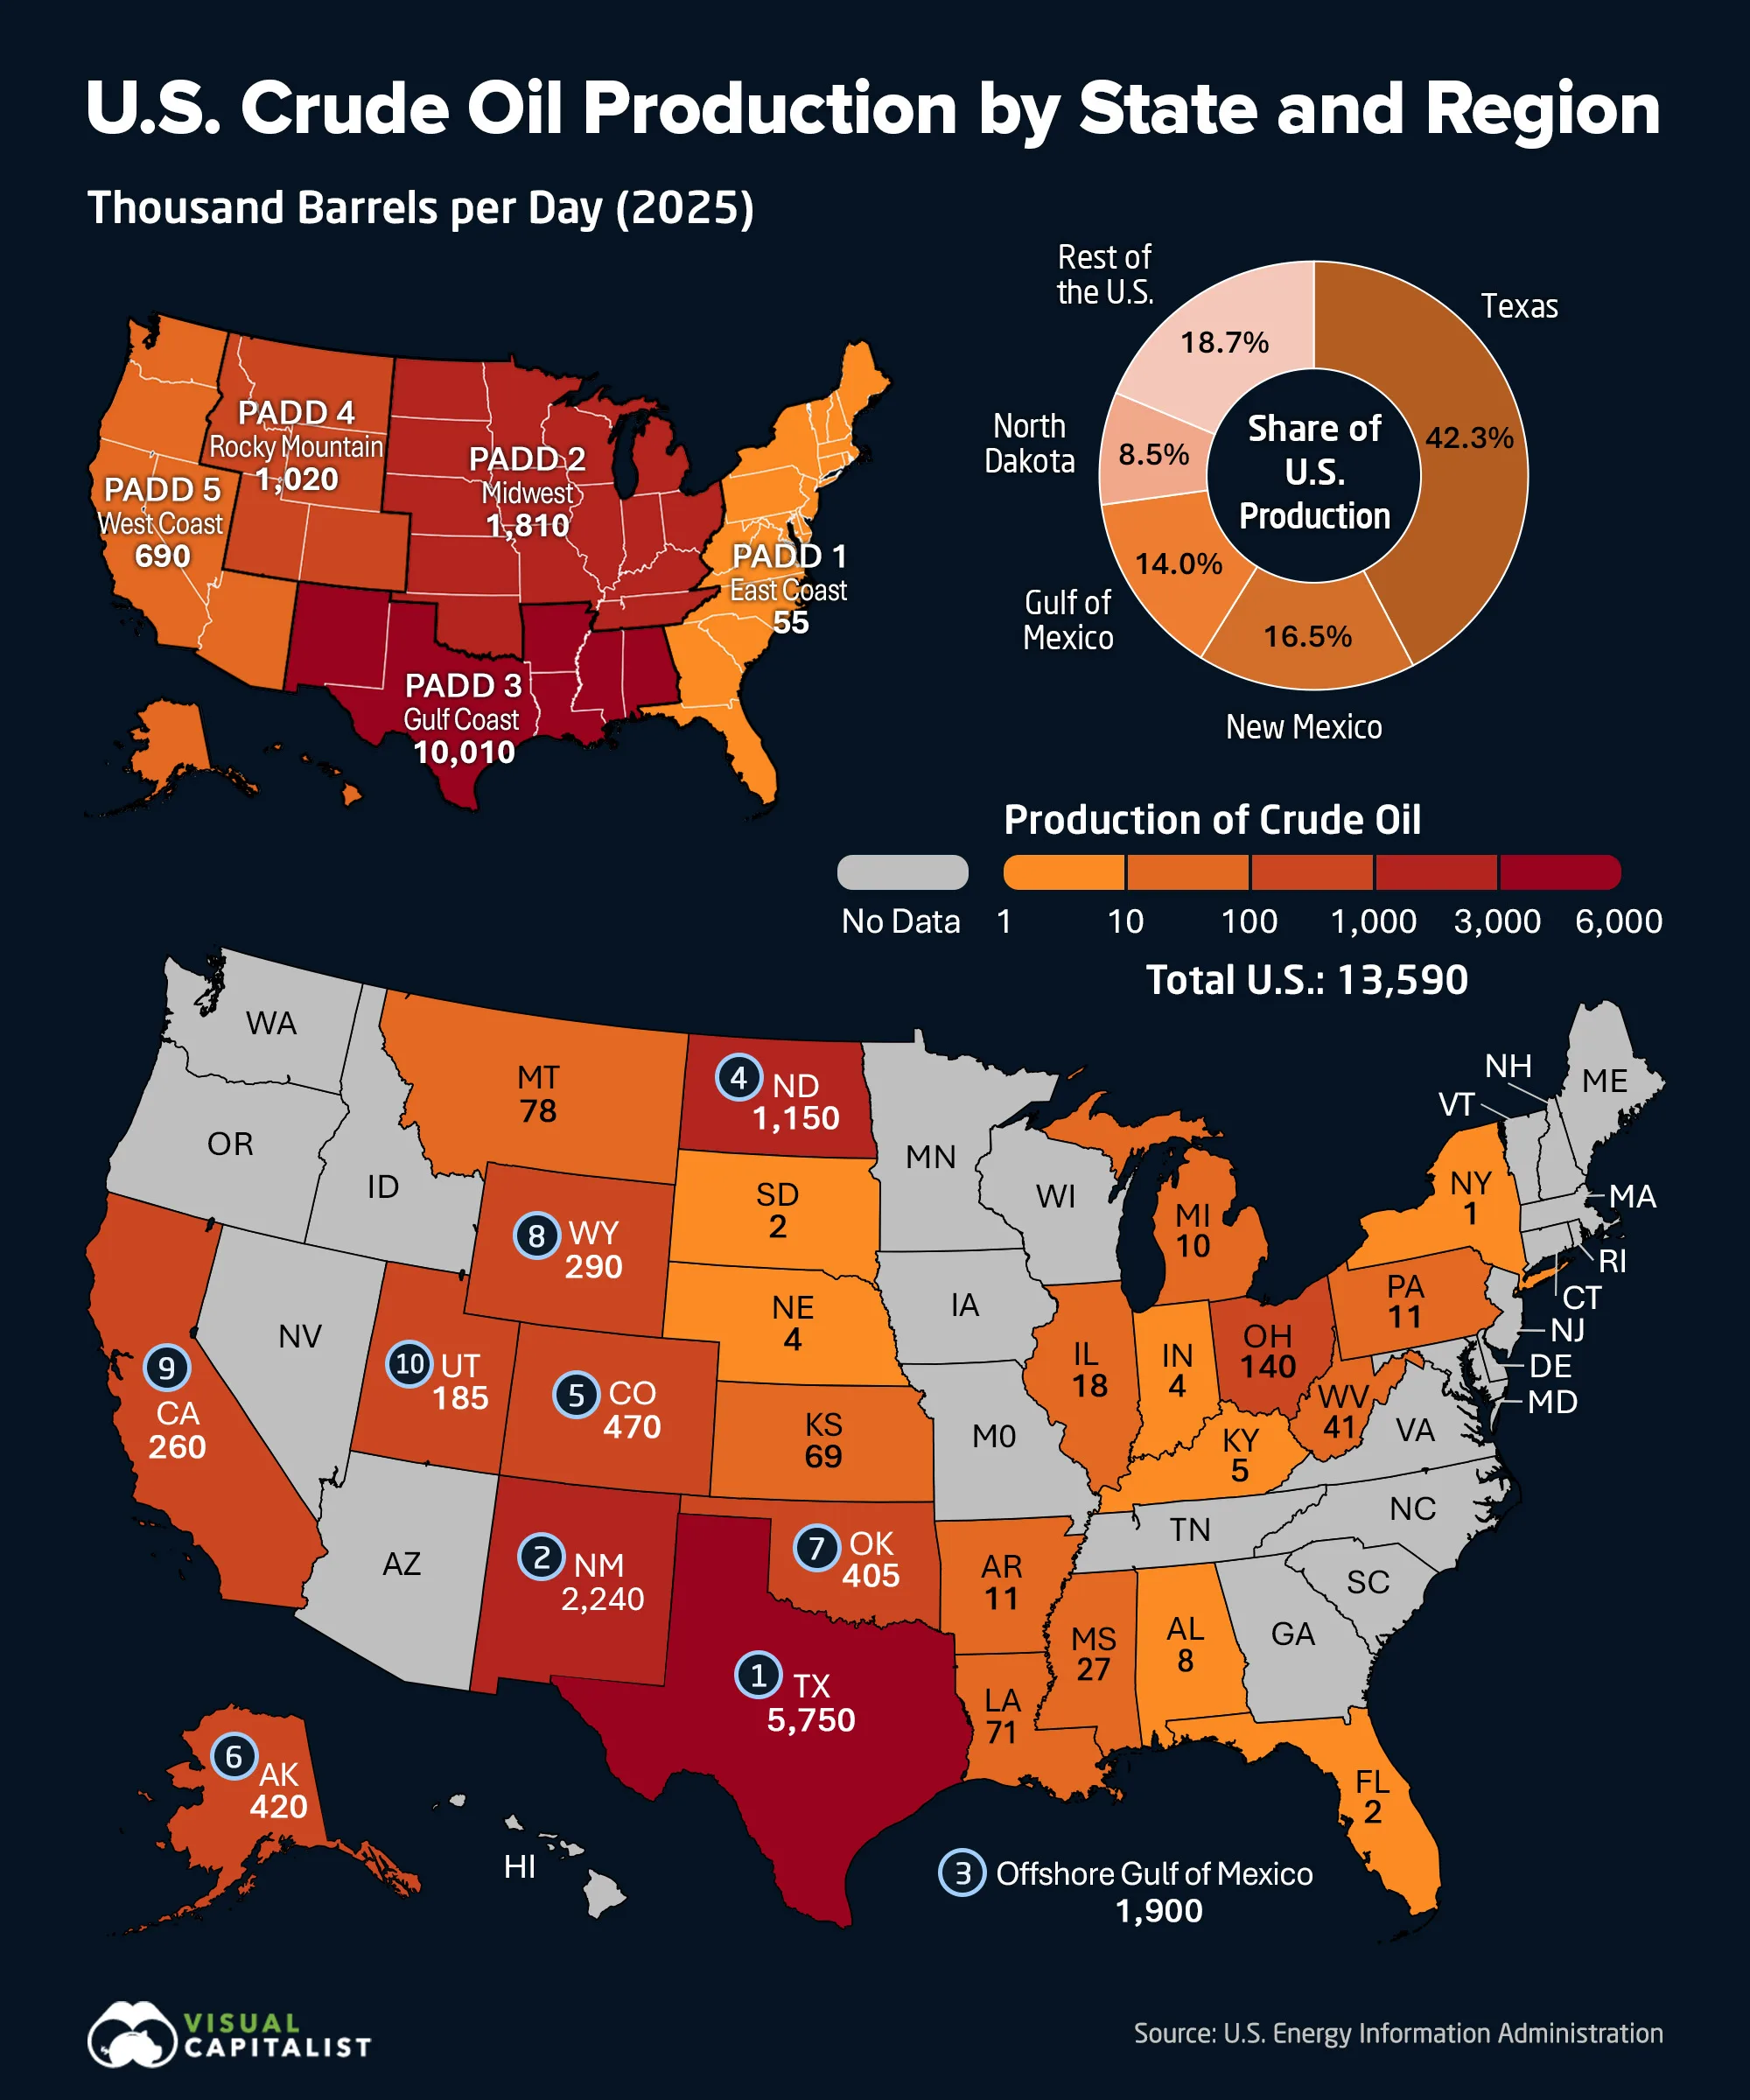
Mapped: U.S. Oil Production by State in 2025
Key Takeaways
- Texas and New Mexico produced a combined 8.0 million bpd, accounting for 58.8% of national output, largely due to the Permian Basin they share.
- The Gulf Coast supplied 73.7% of U.S. crude, while the East Coast, home to more than a third of Americans, produced just 0.4%.
America pumped more crude oil in 2025 than any country has ever produced in a single year.
National production averaged a record 13.6 million bpd, up 3% from the previous year, according to the U.S. Energy Information Administration’s annual Crude Oil Production table.
This map shows crude oil production across 27 states and producing areas, along with the five Petroleum Administration for Defense Districts, or PADDs. Created in 1942 to support gasoline rationing during World War II, the districts remain the standard geography for U.S. petroleum statistics.
Texas Produced 42% of U.S. Crude Oil in 2025
Texas led the country with 5.75 million bpd in 2025, equal to 42.3% of national production. New Mexico ranked second at 2.24 million bpd, or 16.5%.
The table below ranks all 27 states and producing areas by average 2025 output, measured in thousands of barrels per day. Together, they accounted for 99.9% of national production, with the remainder coming from producers too small for the EIA to list separately:
| Rank | State or Producing Area | Crude Oil Production (Thousand Barrels per Day) | Share of U.S. Production (%) |
|---|---|---|---|
| 1 | Texas | 5,751 | 42.3 |
| 2 | New Mexico | 2,244 | 16.5 |
| 3 | Gulf of Mexico | 1,898 | 14.0 |
| 4 | North Dakota | 1,154 | 8.5 |
| 5 | Colorado | 467 | 3.4 |
| 6 | Alaska | 421 | 3.1 |
| 7 | Oklahoma | 405 | 3.0 |
| 8 | Wyoming | 289 | 2.1 |
| 9 | California | 257 | 1.9 |
| 10 | Utah | 185 | 1.4 |
| 11 | Ohio | 139 | 1.0 |
| 12 | Montana | 78 | 0.6 |
| 13 | Louisiana | 71 | 0.5 |
| 14 | Kansas | 69 | 0.5 |
| 15 | West Virginia | 41 | 0.3 |
| 16 | Mississippi | 27 | 0.2 |
| 17 | Illinois | 18 | 0.1 |
| 18 | Pennsylvania | 11 | 0.1 |
| 19 | Arkansas | 11 | 0.1 |
| 20 | Michigan | 10 | 0.1 |
| 21 | Alabama | 8 | 0.1 |
| 22 | Kentucky | 5 | 0.0 |
| 23 | Indiana | 4 | 0.0 |
| 24 | Nebraska | 4 | 0.0 |
| 25 | Florida | 2 | 0.0 |
| 26 | South Dakota | 2 | 0.0 |
| 27 | New York | 1 | 0.0 |
Texas and New Mexico produced a combined 8.0 million bpd, or 58.8% of the U.S. total, largely because of a single geological formation. The Permian Basin spans West Texas and southeastern New Mexico and accounted for 48% of all U.S. crude output in 2025.
The scale becomes clearer in a global context. If Texas were a country, it would rank as the world’s fourth-largest oil producer, ahead of Canada and Iraq. New Mexico would rank around 11th, just behind Kuwait. This graphic compares the world’s top crude oil producers with America’s leading oil-producing regions.
Four Areas Supplied 81% of America’s Oil
Below the top two, the ranking reflects three major shale regions and one offshore production area.
The offshore Gulf of Mexico ranked third at 1.90 million bpd, or 14.0%, while North Dakota, driven largely by the Bakken formation, ranked fourth at 1.15 million bpd, or 8.5%. Combined with Texas and New Mexico, these four areas supplied 11.05 million bpd, equal to 81.3% of national output.
The drop-off after the top four is steep. Each of the remaining 23 areas produced less than 500,000 bpd, led by Colorado at 467,000, Alaska at 421,000, and Oklahoma at 405,000. The 16 lowest-ranked states produced a combined 362,000 bpd, less than Oklahoma produced on its own.
Few states illustrate the shift in U.S. oil production better than Alaska. In 1988, at the peak of Prudhoe Bay, Alaska outproduced Texas to become the country’s leading oil-producing state. Today, Texas produces roughly 14 times as much crude as Alaska.
The Gulf Coast Produced Nearly Three-Quarters of U.S. Crude
Grouped into PADDs, production is even more concentrated than it appears at the state level. The Gulf Coast, or PADD 3, produced 10.01 million bpd in 2025, almost three times as much as the other four regions combined.
The region’s name understates its geographic reach. PADD 3 includes Texas and landlocked New Mexico, along with the federal waters of the Gulf of Mexico. Those three producing areas alone account for almost 99% of the region’s output.
| PADD Region | Crude Oil Production (Thousand Barrels per Day) | Share of U.S. Production (%) |
|---|---|---|
| Gulf Coast (PADD 3) | 10,010 | 73.7 |
| Midwest (PADD 2) | 1,811 | 13.3 |
| Rocky Mountain (PADD 4) | 1,020 | 7.5 |
| West Coast (PADD 5) | 690 | 5.1 |
| East Coast (PADD 1) | 55 | 0.4 |
At the opposite end is the East Coast, or PADD 1, which is home to more than a third of the U.S. population but produces just 0.4% of the country’s crude oil. Its entire output of 55,000 bpd comes from four states, with Pennsylvania and West Virginia contributing 52,000 bpd.
Those two states rank second and fifth, respectively, in U.S. natural gas production. The Marcellus and Utica shales beneath them are enormously productive, but they yield primarily natural gas rather than oil. Compare the two maps in our look at where America produces natural gas.
This level of concentration is relatively recent. U.S. output has nearly tripled since 2008, when the country produced about 5 million bpd. The Permian alone contributed 280,000 bpd of the 350,000 bpd increase recorded in 2025, accounting for four-fifths of national growth. That expansion helped transform the U.S. from the world’s largest oil importer into a net exporter, a reversal charted in America’s shift from import giant to net exporter.
Learn More on the Voronoi App 
If you enjoyed today’s post, check out America’s Hottest Oil State? New Mexico on Voronoi.