Mapped: U.S. State Economies Compared to Entire Countries
This was originally posted on our Voronoi app. Download the app for free on iOS or Android and discover incredible data-driven charts from a variety of trusted sources.
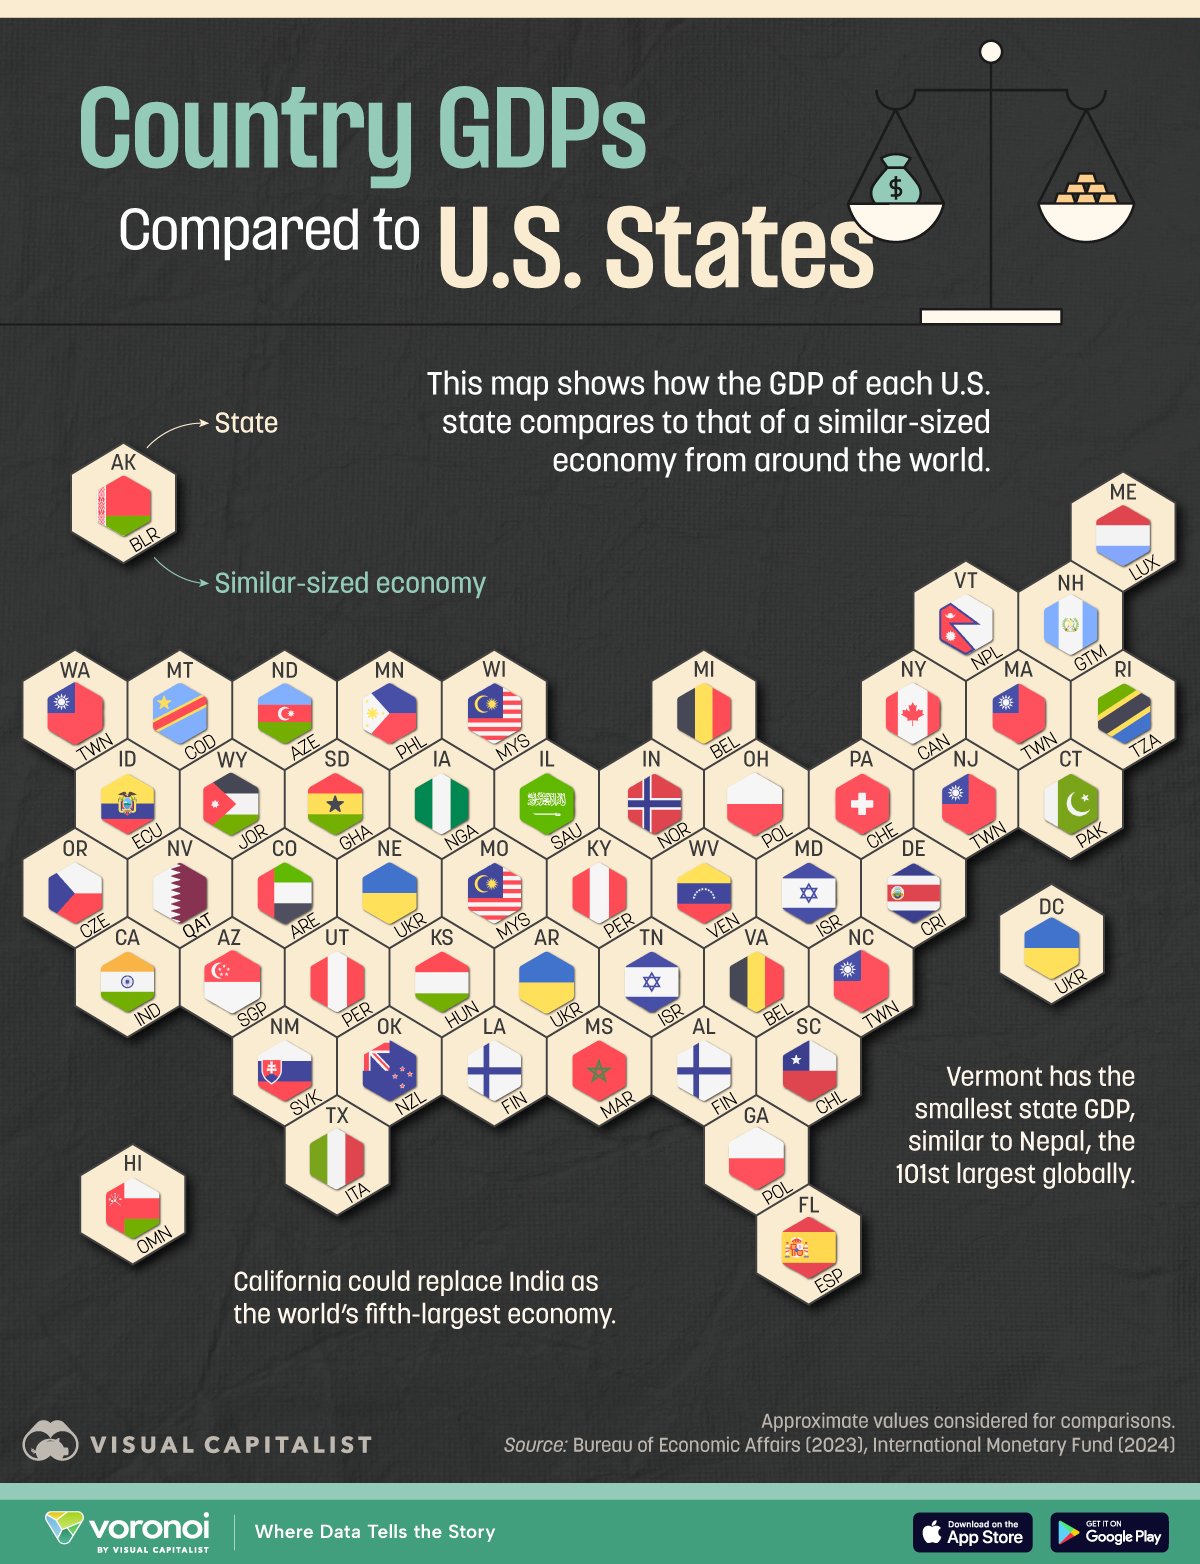
Much like how the world has a few big economic players that dwarf the rest, so too does America’s $29 trillion economy.
To put this unequal distribution in perspective, this map compares U.S. state economies by their gross domestic product (GDP) to that of a similarly-sized country.
State GDP data is sourced from the Bureau of Economic Analysis, the latest available for the year 2023. Meanwhile, country GDP data from the International Monetary Fund, last updated October 2024.
Ranked: U.S. States by their Gross Domestic Product
California has the largest state economy in America, with an output nearly equal to India, the 5th largest economy in the world.
As an additional comparison, it matches India’s GDP with only about 3% of the population.
| Rank | State | 2023 GDP | Equivalent Country |
|---|---|---|---|
| 1 | California | $3.9T |  India India |
| 2 | Texas | $2.6T |  Italy Italy |
| 3 | New York | $2.2T |  Canada Canada |
| 4 | Florida | $1.6T |  Spain Spain |
| 5 | Illinois | $1.1T |  Saudi Arabia Saudi Arabia |
| 6 | Pennsylvania | $976B |  Switzerland Switzerland |
| 7 | Ohio | $885B |  Poland Poland |
| 8 | Georgia | $832B | Poland |
| 9 | Washington | $808B |  Taiwan Taiwan |
| 10 | New Jersey | $806B | Taiwan |
| 11 | North Carolina | $788B | Taiwan |
| 12 | Massachusetts | $736B | Taiwan |
| 13 | Virginia | $719B |  Belgium Belgium |
| 14 | Michigan | $674B | Belgium |
| 15 | Colorado | $530B |  UAE UAE |
| 16 | Tennessee | $523B |  Israel Israel |
| 17 | Arizona | $523B |  Singapore Singapore |
| 18 | Maryland | $516B | Israel |
| 19 | Indiana | $500B |  Norway Norway |
| 20 | Minnesota | $483B |  Philippines Philippines |
| 21 | Missouri | $430B |  Malaysia Malaysia |
| 22 | Wisconsin | $428B | Malaysia |
| 23 | Connecticut | $346B |  Pakistan Pakistan |
| 24 | South Carolina | $327B |  Chile Chile |
| 25 | Oregon | $319B |  Czech Republic Czech Republic |
| 26 | Louisiana | $315B |  Finland Finland |
| 27 | Alabama | $305B | Finland |
| 28 | Utah | $281B |  Peru Peru |
| 29 | Kentucky | $280B | Peru |
| 30 | Oklahoma | $257B |  New Zealand New Zealand |
| 31 | Iowa | $254B |  Nigeria Nigeria |
| 32 | Nevada | $246B |  Qatar Qatar |
| 33 | Kansas | $228B |  Hungary Hungary |
| 34 | Nebraska | $181B |  Ukraine Ukraine |
| 35 | Arkansas | $179B | Ukraine |
| 36 | Washington D.C.* | $177B | Ukraine |
| 37 | Mississippi | $151B |  Morocco Morocco |
| 38 | New Mexico | $135B |  Slovakia Slovakia |
| 39 | Idaho | $121B |  Ecuador Ecuador |
| 40 | New Hampshire | $114B |  Guatemala Guatemala |
| 41 | Hawaii | $110B |  Oman Oman |
| 42 | West Virginia | $102B |  Venezuela Venezuela |
| 43 | Delaware | $98B |  Costa Rica Costa Rica |
| 44 | Maine | $93B |  Luxembourg Luxembourg |
| 45 | Rhode Island | $78B |  Tanzania Tanzania |
| 46 | North Dakota | $76B |  Azerbaijan Azerbaijan |
| 47 | South Dakota | $74B |  Ghana Ghana |
| 48 | Montana | $73B |  DRC DRC |
| 49 | Alaska | $68B |  Belarus Belarus |
| 50 | Wyoming | $52B |  Jordan Jordan |
| 51 | Vermont | $44B |  Nepal Nepal |
Note: *U.S. Territory. Approximate values considered for comparisons.
Other eye-opening comparisons show just how far ahead the U.S. economy really is, even to its closest peers.
For example, Texas is as big as Italy (8th largest in the world), New York as big as Canada (9th largest), Florida as big as Spain (15th largest) and Illinois as big as Saudi Arabia (19th largest).
Naturally these states are also the country’s most populous, and—particularly for California and New York—have emerged as global hubs for tech and financial companies.
But that doesn’t mean all American states are economic powerhouses rivaling other world economies.
Vermont, the U.S. state with the smallest GDP, has an economy comparable to Nepal, the world’s 101st largest economy. However, Nepal’s population is over 29 times larger than Vermont’s, which is just past half a million people.
Learn More on the Voronoi App 
The map above shows that the American economy is unusually productive for its population. Check out Ranked: Top Countries by GDP per Capita to see how the U.S. has been climbing up the ranks since 2014.
The post Mapped: U.S. State Economies Compared to Entire Countries appeared first on Visual Capitalist.


