Where Are Women More Likely to Go to College?
Key Takeaways
- Women have higher college enrollment rates than men in 130 countries worldwide.
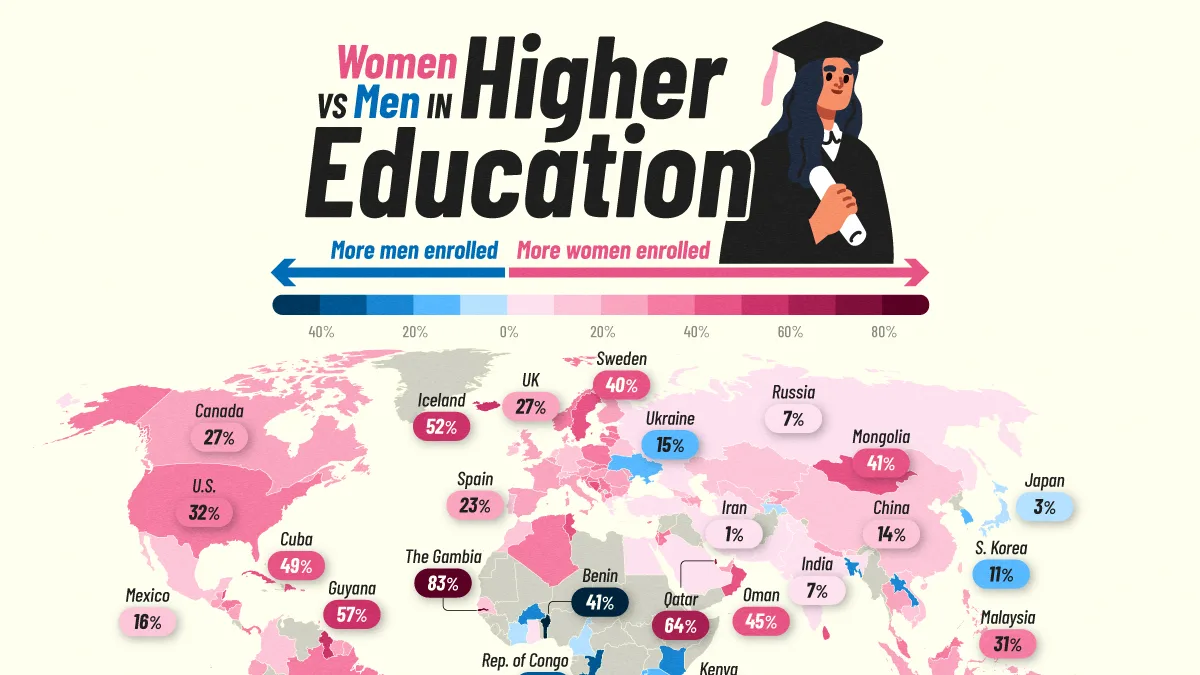
- The divide is particularly wide in several major economies, including Sweden (+40%), Brazil (+36%), the U.S. (+32%), and Australia (+31%).
- Japan and South Korea buck the trend among advanced economies, with higher enrollment rates among men.
Over the last quarter-century, the balance in higher education has shifted increasingly toward women. Globally, women and men reached near-parity in tertiary enrollment around 2000, but female enrollment has since pulled ahead.
This graphic maps differences in tertiary enrollment between women and men worldwide, based on World Bank and UNESCO Institute for Statistics data. Figures represent the most recent year available for each country, ranging from 2022 to 2025.
Women Lead College Enrollment Across Most of the World
Globally, the female tertiary enrollment rate is 12% higher than the male rate. The difference ranges from women leading by more than 80% in some countries to men leading by more than 40% in others.
In the table below, positive figures indicate higher enrollment rates among women, while negative figures indicate higher rates among men.
| Country | Women vs. Men Enrollment Gap |
|---|---|
 Gambia Gambia |
83% |
 Sint Maarten Sint Maarten |
78% |
 St. Vincent and the Grenadines St. Vincent and the Grenadines |
68% |
 Qatar Qatar |
64% |
 Maldives Maldives |
64% |
 Tuvalu Tuvalu |
60% |
 Guyana Guyana |
57% |
 Aruba Aruba |
57% |
 Samoa Samoa |
57% |
 Kiribati Kiribati |
56% |
 St. Lucia St. Lucia |
53% |
 Turks and Caicos Islands Turks and Caicos Islands |
52% |
 Iceland Iceland |
52% |
 Seychelles Seychelles |
51% |
 Tonga Tonga |
51% |
 Barbados Barbados |
49% |
 Cuba Cuba |
49% |
 Dominican Republic Dominican Republic |
49% |
 Bahrain Bahrain |
47% |
 Belize Belize |
45% |
 Oman Oman |
45% |
 Argentina Argentina |
45% |
 Tunisia Tunisia |
45% |
 Monaco Monaco |
43% |
 South Africa South Africa |
42% |
 Uruguay Uruguay |
42% |
 Namibia Namibia |
42% |
 Mongolia Mongolia |
41% |
 Sweden Sweden |
40% |
 Bosnia and Herzegovina Bosnia and Herzegovina |
40% |
 Sri Lanka Sri Lanka |
40% |
 Trinidad and Tobago Trinidad and Tobago |
39% |
 Botswana Botswana |
39% |
 New Zealand New Zealand |
38% |
 Malta Malta |
38% |
 West Bank and Gaza West Bank and Gaza |
38% |
 British Virgin Islands British Virgin Islands |
37% |
 Poland Poland |
37% |
 Panama Panama |
37% |
 Puerto Rico Puerto Rico |
37% |
 Brazil Brazil |
36% |
 Algeria Algeria |
35% |
 Brunei Darussalam Brunei Darussalam |
35% |
 Estonia Estonia |
34% |
 Norway Norway |
34% |
 Slovenia Slovenia |
34% |
 Montenegro Montenegro |
34% |
 Bermuda Bermuda |
34% |
 Honduras Honduras |
33% |
 Palau Palau |
33% |
 Jordan Jordan |
33% |
 Croatia Croatia |
33% |
 Latvia Latvia |
32% |
 Cyprus Cyprus |
32% |
 U.S. U.S. |
32% |
 Slovakia Slovakia |
31% |
 Lithuania Lithuania |
31% |
 Australia Australia |
31% |
 Malaysia Malaysia |
31% |
 Serbia Serbia |
30% |
 Israel Israel |
30% |
 North Macedonia North Macedonia |
30% |
 Bulgaria Bulgaria |
29% |
 Denmark Denmark |
29% |
 Nicaragua Nicaragua |
29% |
 Italy Italy |
29% |
 Kyrgyzstan Kyrgyzstan |
28% |
 Armenia Armenia |
28% |
 Suriname Suriname |
27% |
 Marshall Islands Marshall Islands |
27% |
 United Kingdom United Kingdom |
27% |
 Belgium Belgium |
27% |
 Canada Canada |
27% |
 Thailand Thailand |
26% |
 El Salvador El Salvador |
26% |
 Czechia Czechia |
26% |
 France France |
25% |
 Finland Finland |
25% |
 Albania Albania |
24% |
 Moldova Moldova |
24% |
 Romania Romania |
24% |
 Austria Austria |
23% |
 Spain Spain |
23% |
 Fiji Fiji |
22% |
 Azerbaijan Azerbaijan |
22% |
 Philippines Philippines |
22% |
 UAE UAE |
22% |
 Nepal Nepal |
22% |
 Zimbabwe Zimbabwe |
21% |
 Hungary Hungary |
21% |
 Ecuador Ecuador |
21% |
 Guatemala Guatemala |
21% |
 Indonesia Indonesia |
20% |
 Morocco Morocco |
19% |
 Ireland Ireland |
19% |
 Portugal Portugal |
18% |
 Kazakhstan Kazakhstan |
17% |
 Georgia Georgia |
16% |
 Mexico Mexico |
16% |
 Vietnam Vietnam |
16% |
 Luxembourg Luxembourg |
16% |
 Netherlands Netherlands |
16% |
 Chile Chile |
15% |
 Colombia Colombia |
15% |
 Uzbekistan Uzbekistan |
14% |
 Belarus Belarus |
14% |
 China China |
14% |
 Switzerland Switzerland |
12% |
 World World |
12% |
 Bhutan Bhutan |
11% |
 Cambodia Cambodia |
11% |
 Senegal Senegal |
11% |
 Macao Macao |
11% |
 Germany Germany |
10% |
 Hong Kong SAR Hong Kong SAR |
9% |
 Andorra Andorra |
9% |
 Singapore Singapore |
9% |
 India India |
7% |
 Turkmenistan Turkmenistan |
7% |
 Russia Russia |
7% |
 Turkiye Turkiye |
7% |
 Greece Greece |
7% |
 Timor-Leste Timor-Leste |
4% |
 Egypt Egypt |
3% |
 Pakistan Pakistan |
3% |
 Ghana Ghana |
2% |
 Madagascar Madagascar |
2% |
 San Marino San Marino |
1% |
 Saudi Arabia Saudi Arabia |
1% |
 Iran Iran |
1% |
 Mauritius Mauritius |
0% |
 Angola Angola |
-1% |
 Cote d’Ivoire Cote d’Ivoire |
-2% |
 Japan Japan |
-3% |
 Cameroon Cameroon |
-4% |
 Tajikistan Tajikistan |
-5% |
 Burundi Burundi |
-10% |
 South Korea South Korea |
-11% |
 Ukraine Ukraine |
-15% |
 Tanzania Tanzania |
-18% |
 Rwanda Rwanda |
-20% |
 Kenya Kenya |
-21% |
 Bangladesh Bangladesh |
-23% |
 Laos Laos |
-25% |
 Burkina Faso Burkina Faso |
-26% |
 Malawi Malawi |
-30% |
 Republic of Congo Republic of Congo |
-33% |
 Benin Benin |
-41% |
 World Average World Average |
12% |
Among major advanced economies, the U.S. has one of the widest differences favoring women. Its female enrollment rate is 32% higher than the male rate, compared with 27% in Canada, 25% in France, and 19% in Ireland, which ranks as the world’s most educated country.
Why Japan and South Korea Buck the Trend
East Asia contains one of the map’s sharpest contrasts.
Women have higher tertiary enrollment rates in China (+14%), Hong Kong (+9%), and Singapore (+9%). Yet the pattern reverses in Japan (-3%) and becomes more pronounced in South Korea (-11%).
One factor that can affect South Korea’s figures is mandatory military service for most able-bodied men, which can interrupt university studies and extend the period over which men remain enrolled.
These figures compare gross enrollment ratios rather than simply counting male and female students. Because gross enrollment can include students outside the typical university-age range, differences in when students enroll and how long they remain in school can also affect the results.
The Divide Continues Beyond Enrollment
The same pattern appears in educational attainment. Across OECD countries, 55% of women aged 25–34 had completed tertiary education in 2024, compared with 42% of men.
Women are also more likely to finish their degrees. OECD data show a persistent completion gap favoring women across bachelor’s programs.
Yet women’s advantage in higher education does not translate into higher earnings, at least yet. Among full-time, full-year workers aged 25–34 across OECD countries, women earn about 17% to 18% less than men with the same level of educational attainment.
Learn More on the Voronoi App
To learn more about global education trends, check out this graphic on the countries with the strongest reading performance.