Ranked: CO2 Emissions Per Person by Major Economy
See visuals like this from many other data creators on our Voronoi app. Download it for free on iOS or Android and discover incredible data-driven charts from a variety of trusted sources.
Key Takeaways
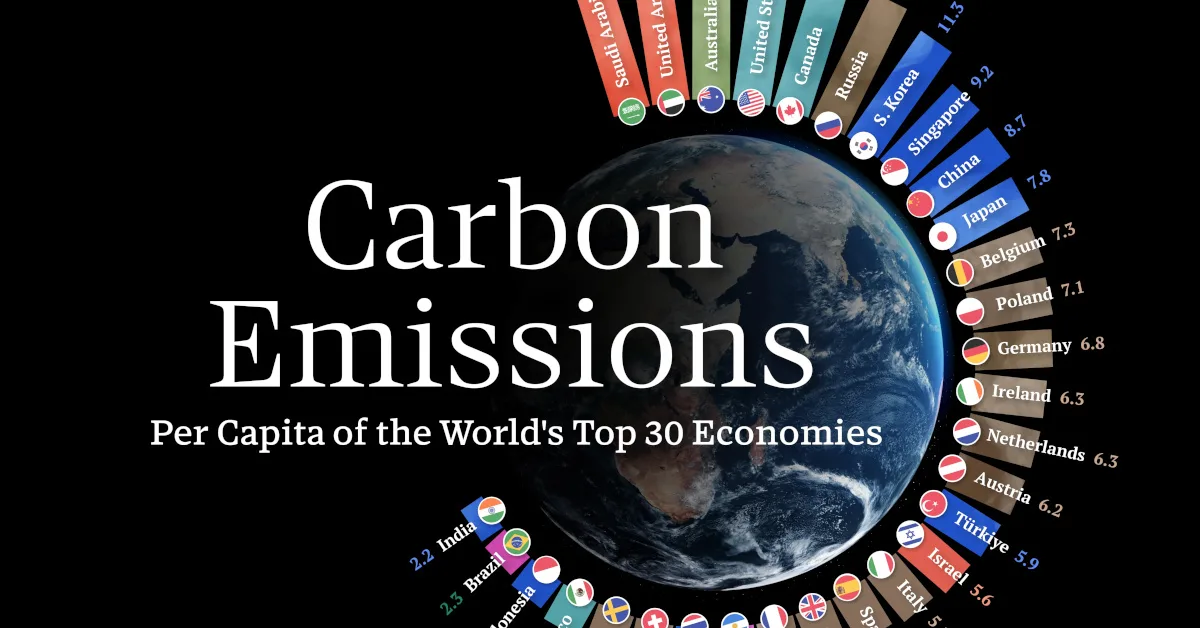
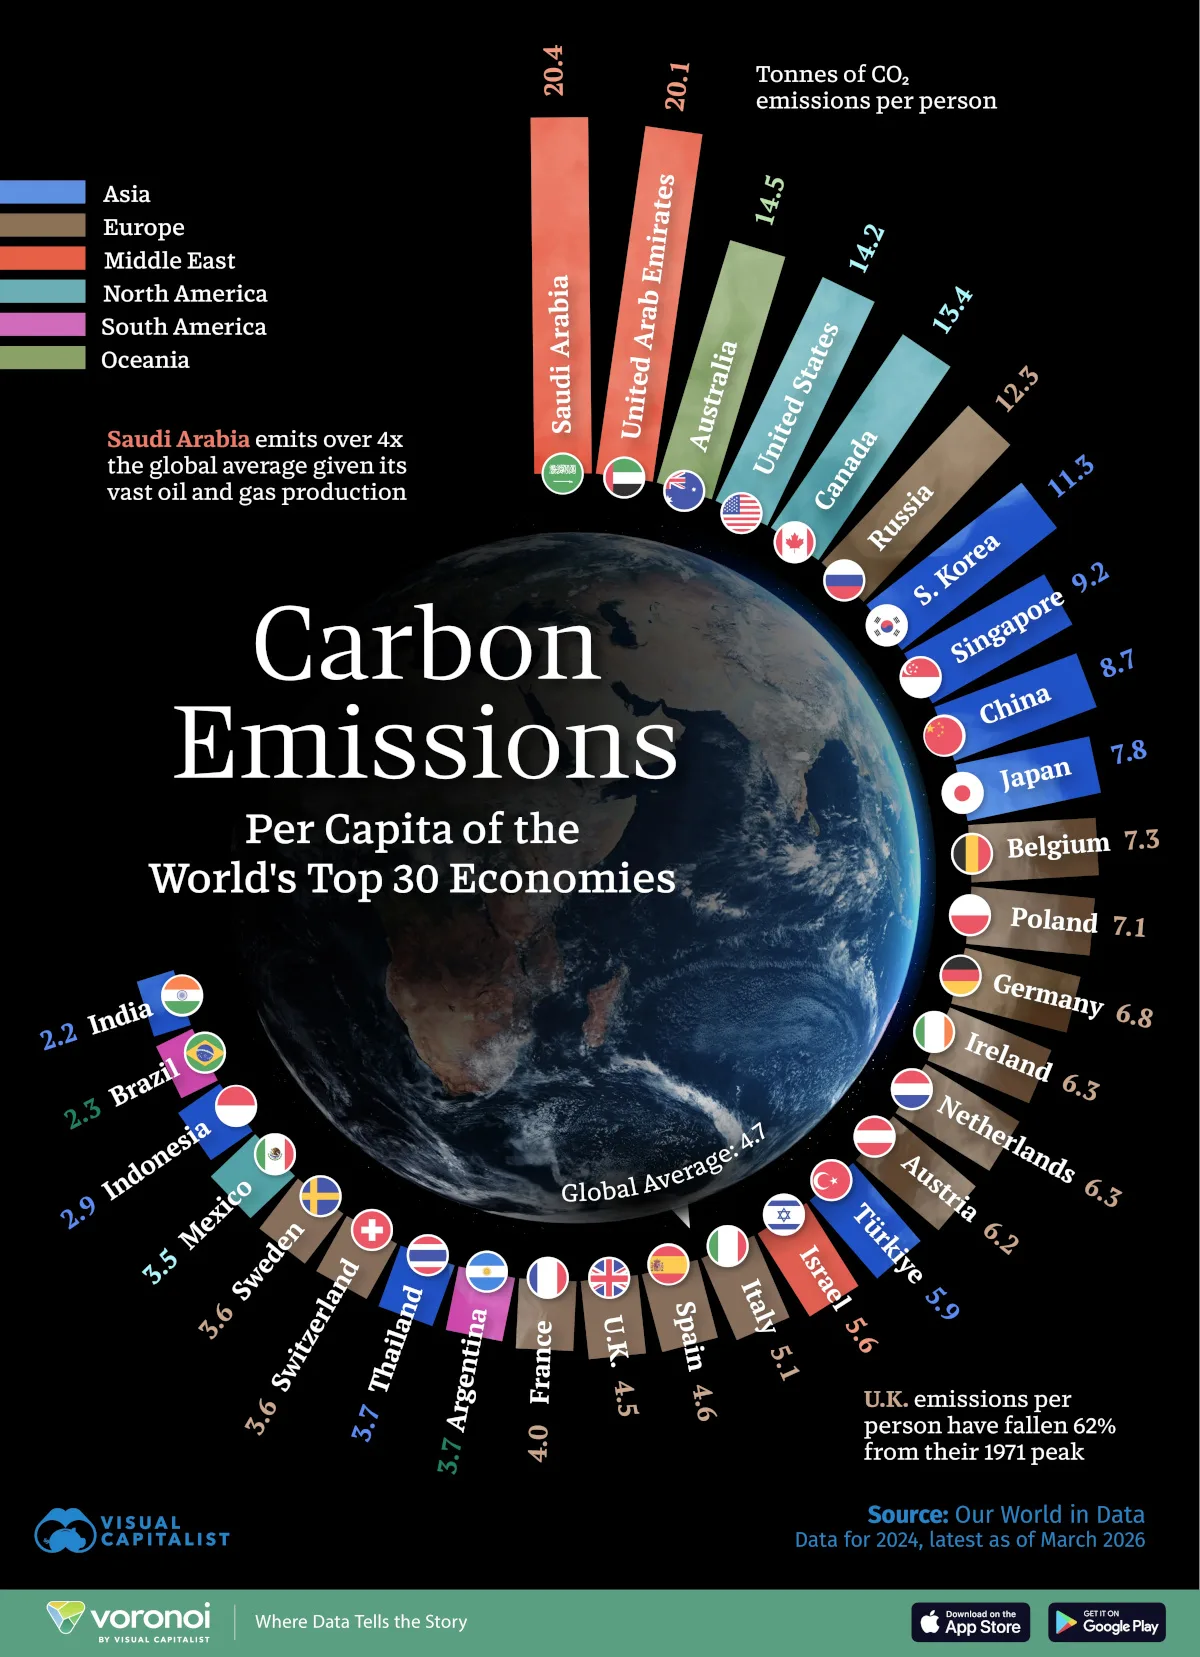
- Oil-rich economies dominate the top of the list, with Saudi Arabia emitting over four times the global average.
- Australia, the U.S., and Canada all rank in the top five, driven by high consumption and energy production.
- Despite being the world’s largest emitter overall, China sits in the middle, while India ranks last by per capita emissions.
Carbon emissions are often measured at the national level, but that can mask a key reality: how much each person actually contributes.
This graphic ranks CO₂ emissions relative to population across the world’s 30 largest economies, highlighting sharp differences between countries with similar levels of wealth.
From oil-rich nations to industrial powerhouses, the latest figures from Our World in Data shows that where you live can dramatically shape your personal carbon footprint, with some countries emitting nearly 10x more per person than others.
Which Countries Emit the Most CO₂ Per Person?
The table below shows the CO₂ emissions per capita of the world’s top 30 economies by GDP, measured in tonnes per person in 2024:
| Rank | Country | CO₂ Emissions per Capita 2024 (tonnes per person) |
Region |
|---|---|---|---|
| 1 |  Saudi Arabia Saudi Arabia |
20.4 | Middle East |
| 2 |  UAE UAE |
20.1 | Middle East |
| 3 |  Australia Australia |
14.5 | Oceania |
| 4 |  U.S. U.S. |
14.2 | North America |
| 5 |  Canada Canada |
13.4 | North America |
| 6 |  Russia Russia |
12.3 | Europe |
| 7 |  South Korea South Korea |
11.3 | Asia |
| 8 |  Singapore Singapore |
9.2 | Asia |
| 9 |  China China |
8.7 | Asia |
| 10 |  Japan Japan |
7.8 | Asia |
| 11 |  Belgium Belgium |
7.3 | Europe |
| 12 |  Poland Poland |
7.1 | Europe |
| 13 |  Germany Germany |
6.8 | Europe |
| 14 |  Ireland Ireland |
6.3 | Europe |
| 15 |  Netherlands Netherlands |
6.3 | Europe |
| 16 |  Austria Austria |
6.2 | Europe |
| 17 |  Türkiye Türkiye |
5.9 | Asia |
| 18 |  Israel Israel |
5.6 | Middle East |
| 19 |  Italy Italy |
5.1 | Europe |
| 20 |  Spain Spain |
4.6 | Europe |
| 21 |  UK UK |
4.5 | Europe |
| 22 |  France France |
4.0 | Europe |
| 23 |  Argentina Argentina |
3.7 | South America |
| 24 |  Thailand Thailand |
3.7 | Asia |
| 25 |  Switzerland Switzerland |
3.6 | Europe |
| 26 |  Sweden Sweden |
3.6 | Europe |
| 27 |  Mexico Mexico |
3.5 | North America |
| 28 |  Indonesia Indonesia |
2.9 | Asia |
| 29 |  Brazil Brazil |
2.3 | South America |
| 30 |  India India |
2.2 | Asia |
Saudi Arabia and the UAE each exceed 20 tonnes of CO₂ per person, driven by energy-intensive industries, fossil fuel dependence, and relatively small populations.
At the same time, they rank among the highest per capita emitters globally. Following next in line are Australia, the U.S. and Canada, which emit around three times the global average emissions per capita. This reflects their resource-heavy industries and high energy consumption.
Similarly, Russia’s extensive energy production makes it the largest emitter among major economies in Europe, with 12.3 tonnes of CO₂ emissions per person.
Asia’s Divide in Emissions Per Capita
Across Asia’s largest economies, per person emissions cover a wide spectrum.
South Korea leads the region at 11.3 tonnes of CO₂ per capita, driven by energy and manufacturing industries. Singapore follows, at 9.2 tonnes of CO₂ emissions per capita, home to one of the world’s largest oil refining and trading hubs.
China, meanwhile, emits 8.7 tonnes per person, or nearly double the global average. While it remains the world’s largest emitter overall, it has also become a global leader in clean energy, from solar to electric vehicles, and is investing heavily in scaling green hydrogen.
At the other end of the spectrum is India, with 2.2 tonnes per capita. Despite continued reliance on coal, the country has set—and surpassed—ambitious solar targets, and is on track to triple its renewable energy capacity by 2030 compared to 2022 levels.
Learn More on the Voronoi App 
To learn more about this topic, check out this graphic on the world’s carbon emissions by sector.