Ranked: The Largest Oil Supply Disruptions in History
Key Takeaways
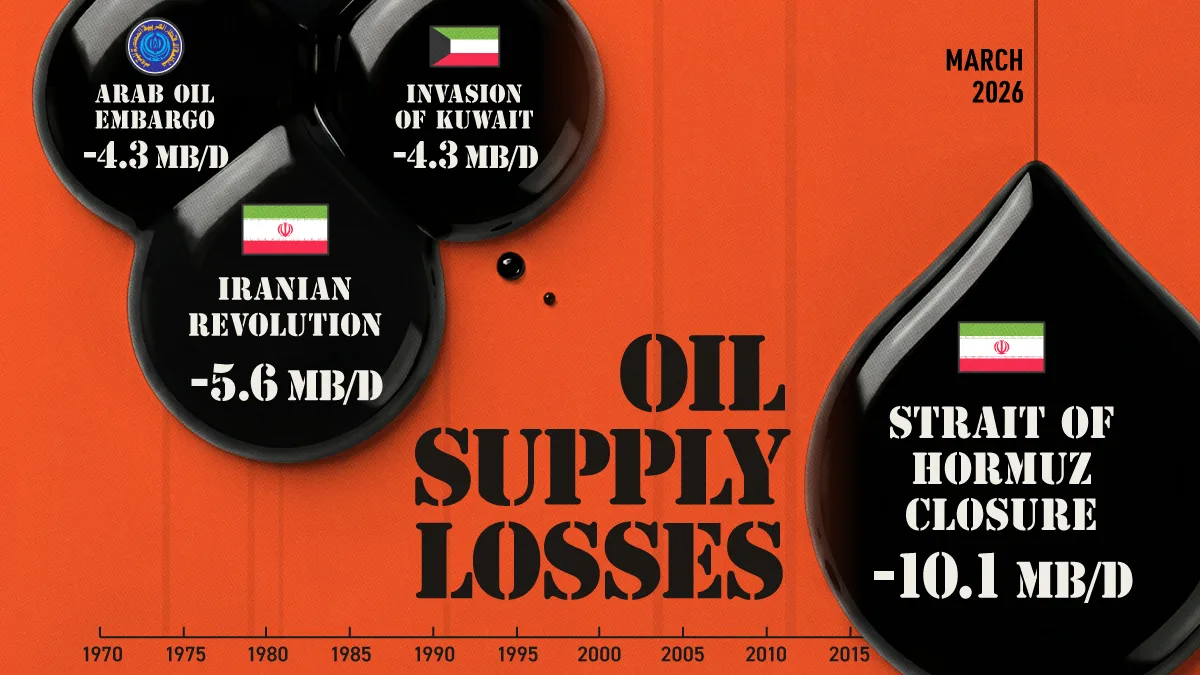
- The closure of the Strait of Hormuz caused a supply loss of 10.1 million barrels per day in March 2026, the largest oil supply shock on record.
- The Strait of Hormuz closure caused an oil supply loss nearly twice the 5.6 million barrels per day lost during the Iranian Revolution, the next-largest disruption.
- Four of the seven major supply disruptions shown occurred between 1973 and 1991, including the Arab oil embargo, Iran-Iraq War, and invasion of Kuwait.
Wars, revolutions, embargoes, and chokepoint disruptions have repeatedly removed millions of barrels of oil per day from global markets, putting pressure on prices and energy security.
This visualization compares seven major oil supply disruptions, measured in millions of barrels per day. The data comes from the IEA via the World Bank Commodity Markets Outlook, with the figure for the Strait of Hormuz closure referring specifically to March 2026, the latest available as of April 2026.
Strait of Hormuz Closure Is Largest Oil Supply Disruption in History
The scale of the disruption reflects the Strait of Hormuz’s importance to global energy markets. Located in the Persian Gulf, the world’s leading oil trading region, the strait is a critical maritime chokepoint that typically handles about 20% of global petroleum trade.
Iran has largely blocked shipping traffic through the Strait of Hormuz since February 28, 2026, when the United States and Israel launched an air war against Iran.
The near halt in tanker movements through the strait has caused Gulf countries to cut oil production, with supply losses likely to increase as long as shipping flows remain affected.
| Event | Timeframe | Oil supply loss in million barrels per day |
|---|---|---|
| Strait of Hormuz closure | March 2026 | -10.1 |
| Iranian Revolution | November 1978–April 1979 | -5.6 |
| Arab oil embargo | October 1973–March 1974 | -4.3 |
| Invasion of Kuwait | August 1990–January 1991 | -4.3 |
| Iran-Iraq War | October 1980–January 1981 | -4.1 |
| Iraq War | March–December 2003 | -2.3 |
| Civil war in Libya | February–October 2011 | -1.5 |
Before the Strait of Hormuz closure, the Iranian Revolution represented the largest oil supply disruption among the events shown. From November 1978 to April 1979, falling oil production resulted in a supply loss of 5.6 million barrels per day.
The March 2026 Hormuz disruption exceeded that by 4.5 million barrels per day, or about 80%.
Revolutions, Embargoes, and Wars Causing Disruptions
Two other major disruptions each caused losses of 4.3 million barrels per day: the Arab oil embargo and the invasion of Kuwait.
The Arab oil embargo, which lasted from October 1973 to March 1974, caused an almost fourfold increase in oil prices and forced some countries to ration fuel due to shortages. It is considered the first major global oil crisis and led to the creation of the International Energy Agency (IEA).
The invasion of Kuwait disrupted supply from August 1990 to January 1991 and caused global oil prices to double in a matter of days.
Close behind, the Iran-Iraq War caused a supply loss of 4.1 million barrels per day between October 1980 and January 1981.
Smaller, Yet Significant Supply Losses in the 2000s
The early period of the Iraq War (March–December 2003) and the civil war in Libya (February–October 2011) caused smaller losses than the major shocks of the 1970s, 1980s, and early 1990s.
Still, their impacts were significant in absolute terms: the Iraq War caused a supply loss of 2.3 million barrels per day, while Libya’s civil war led to a loss of 1.5 million barrels per day.
Five of the seven disruptions shown are tied to the Middle East, highlighting the region’s outsized importance to global oil supply. The 2026 Strait of Hormuz closure stands apart as the first event in the dataset to surpass a supply loss of 10 million barrels per day.
Learn More on the Voronoi App
If you enjoyed today’s post, check out Mapping: Oil Flows Through the Strait of Hormuz on the Voronoi app, where you can discover thousands of data-driven visualizations from trusted sources around the world.