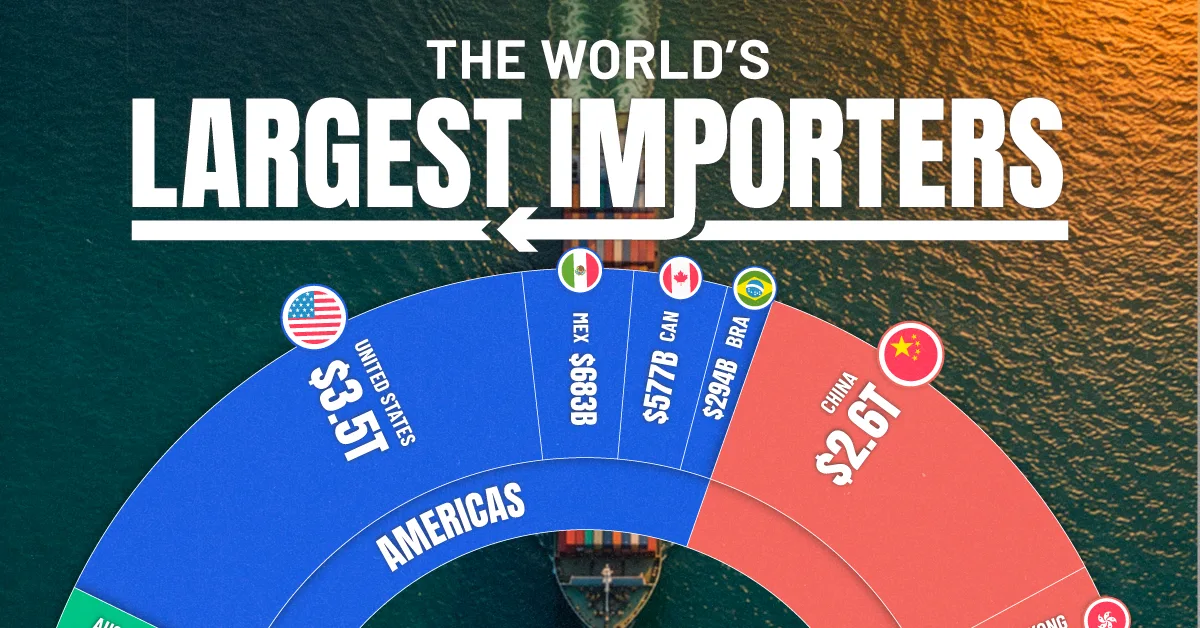
Ranked: The World’s Largest Importers in 2025
See visuals like this from many other data creators on our Voronoi app. Download it for free on iOS or Android and discover data-driven charts from a variety of trusted sources.
Key Takeaways
- The U.S. imports $3.5T in goods, over $900B more than China.
- Asia and Europe dominate global imports, accounting for most of the top 30.
- Germany stands out, importing far more relative to its economy than other major powers.
Despite rising trade tensions, the world’s largest economies remain deeply dependent on imports to function.
In 2025, the United States remained the world’s top importer, accounting for more than 13% of global goods imports. From energy and raw materials to finished products, global supply chains remain critical to both consumption and industrial output.
This graphic ranks the world’s 30 largest importers using the latest available data from the World Trade Organization.
The U.S. is the World’s Top Import Market
In 2025, the United States remained the world’s largest importer by a wide margin. The $3.5 trillion imported by the U.S. is nearly a trillion dollars more than second-place China ($2.6 trillion).
The massive surge in U.S. imports from countries like Canada, China, Japan, and Mexico in recent decades has led to Washington running an over $1 trillion trade deficit, larger than any other country. The strong U.S. dollar also makes imports cheaper—reinforcing America’s role as the world’s largest buyer of goods.
This data table lists the world’s top 30 largest importers alongside their total import value in 2025.
| Rank | Country | Value (Billion USD) | Global Share (%) |
|---|---|---|---|
| 1 |  United States United States |
3,507 | 13.2 |
| 2 |  China China |
2,583 | 9.7 |
| 3 |  Germany Germany |
1,543 | 5.8 |
| 4 |  United Kingdom United Kingdom |
949 | 3.6 |
| 5 |  Netherlands Netherlands |
870 | 3.3 |
| 6 |  Hong Kong Hong Kong |
832 | 3.1 |
| 7 |  France France |
786 | 3.0 |
| 8 |  Japan Japan |
756 | 2.8 |
| 9 |  India India |
753 | 2.8 |
| 10 |  Mexico Mexico |
683 | 2.6 |
| 11 |  Italy Italy |
669 | 2.5 |
| 12 |  South Korea South Korea |
632 | 2.4 |
| 13 |  United Arab Emirates United Arab Emirates |
619 | 2.3 |
| 14 |  Canada Canada |
577 | 2.2 |
| 15 |  Belgium Belgium |
538 | 2.0 |
| 16 |  Spain Spain |
513 | 1.9 |
| 17 |  Switzerland Switzerland |
507 | 1.9 |
| 18 |  Singapore Singapore |
506 | 1.9 |
| 19 |  Taiwan Taiwan |
494 | 1.9 |
| 20 |  Vietnam Vietnam |
454 | 1.7 |
| 21 |  Poland Poland |
421 | 1.6 |
| 22 |  Turkey Turkey |
365 | 1.4 |
| 23 |  Thailand Thailand |
345 | 1.3 |
| 24 |  Malaysia Malaysia |
340 | 1.3 |
| 25 |  Australia Australia |
311 | 1.2 |
| 26 |  Russia Russia |
303 | 1.1 |
| 27 |  Brazil Brazil |
294 | 1.1 |
| 28 |  Saudi Arabia Saudi Arabia |
254 | 1.0 |
| 29 |  Czech Republic Czech Republic |
253 | 1.0 |
| 30 |  Indonesia Indonesia |
242 | 0.9 |
| — |  Top 30 Importers Top 30 Importers |
21,899 | 82.5 |
Many across the U.S. push for the country to reduce its imports and produce more domestically, particularly in manufacturing. High-value goods such as cars, of which the U.S. imported over $216 billion in 2024, are particular points of tension, as well as products made overseas by U.S. firms like Apple’s iPhones.
However, the reality of international supply chains is that even many locally-made products require different imported input components, from car parts to steel to processors. As a result, trade protectionism in the world’s largest consumer market also has an impact on American manufacturers.
China: A Different Type of Importer
While the U.S. imports primarily finished consumer goods, China’s import profile looks very different—focused heavily on raw materials that power its manufacturing engine.
Primary goods such as iron, oil, and soybeans dominate Chinese imports, although there are also key finished products like semiconductors which are essential for local manufacturing. China maintains a fairly major trade surplus of over $1 trillion, although Beijing does run a deficit with certain large emerging markets like Brazil.
Neighboring Hong Kong also imported over $832 billion worth of goods in 2025, with only $232 billion of these being retained imports for local consumption, contrary to goods which were then reexported.
Germany: Punching Above Its Weight
Germany stands out among major economies: despite its smaller size, it imports far more relative to GDP than either the U.S. or China, reflecting its deep integration into global supply chains.
Germany’s $1.5 trillion in 2025 imports is over half of the Chinese total and over 40% of the total for the far larger U.S. economy. Close trade ties within Europe have made Germany one of the most interconnected economies in global trade.
Meanwhile, the country has long depended on foreign energy imports to power its world-renowned domestic industry.
Learn More on the Voronoi App 
If you enjoyed today’s post, check out Global Trade Dominance: U.S., EU, or China (2000 vs. 2024) on Voronoi.Use This Visualization