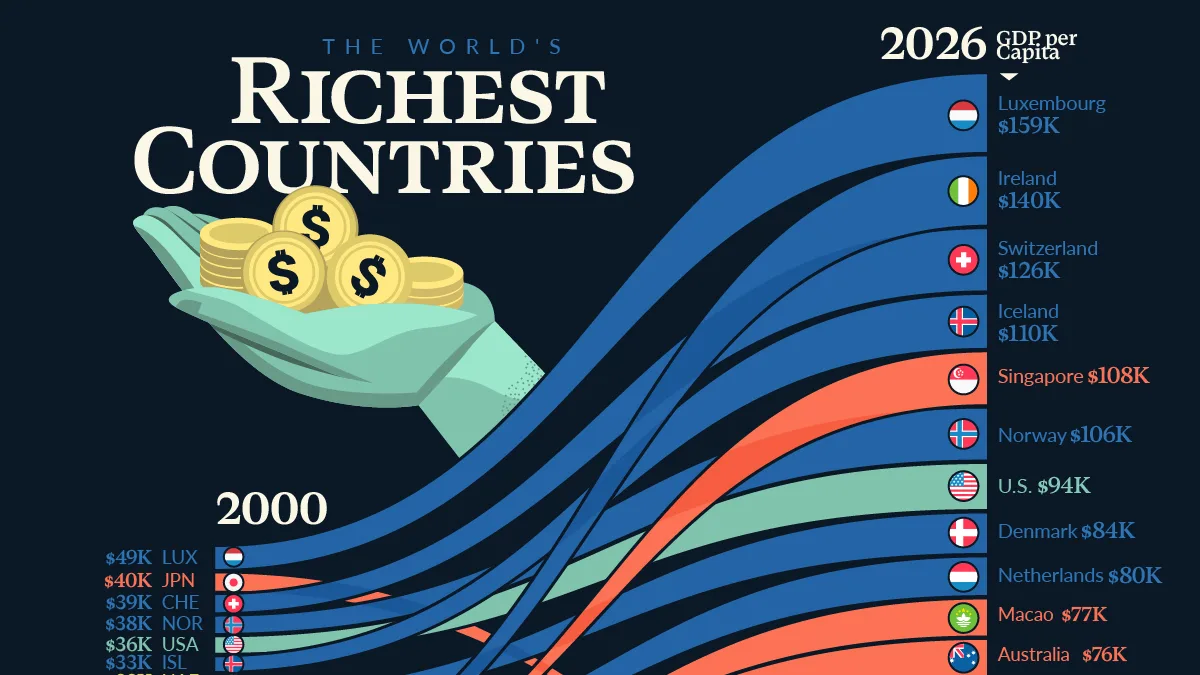
Ranked: The World’s Richest Countries by GDP Per Capita
See visuals like this from many other data creators on our Voronoi app. Download it for free on iOS or Android and discover incredible data-driven charts from a variety of trusted sources.
Key Takeaways
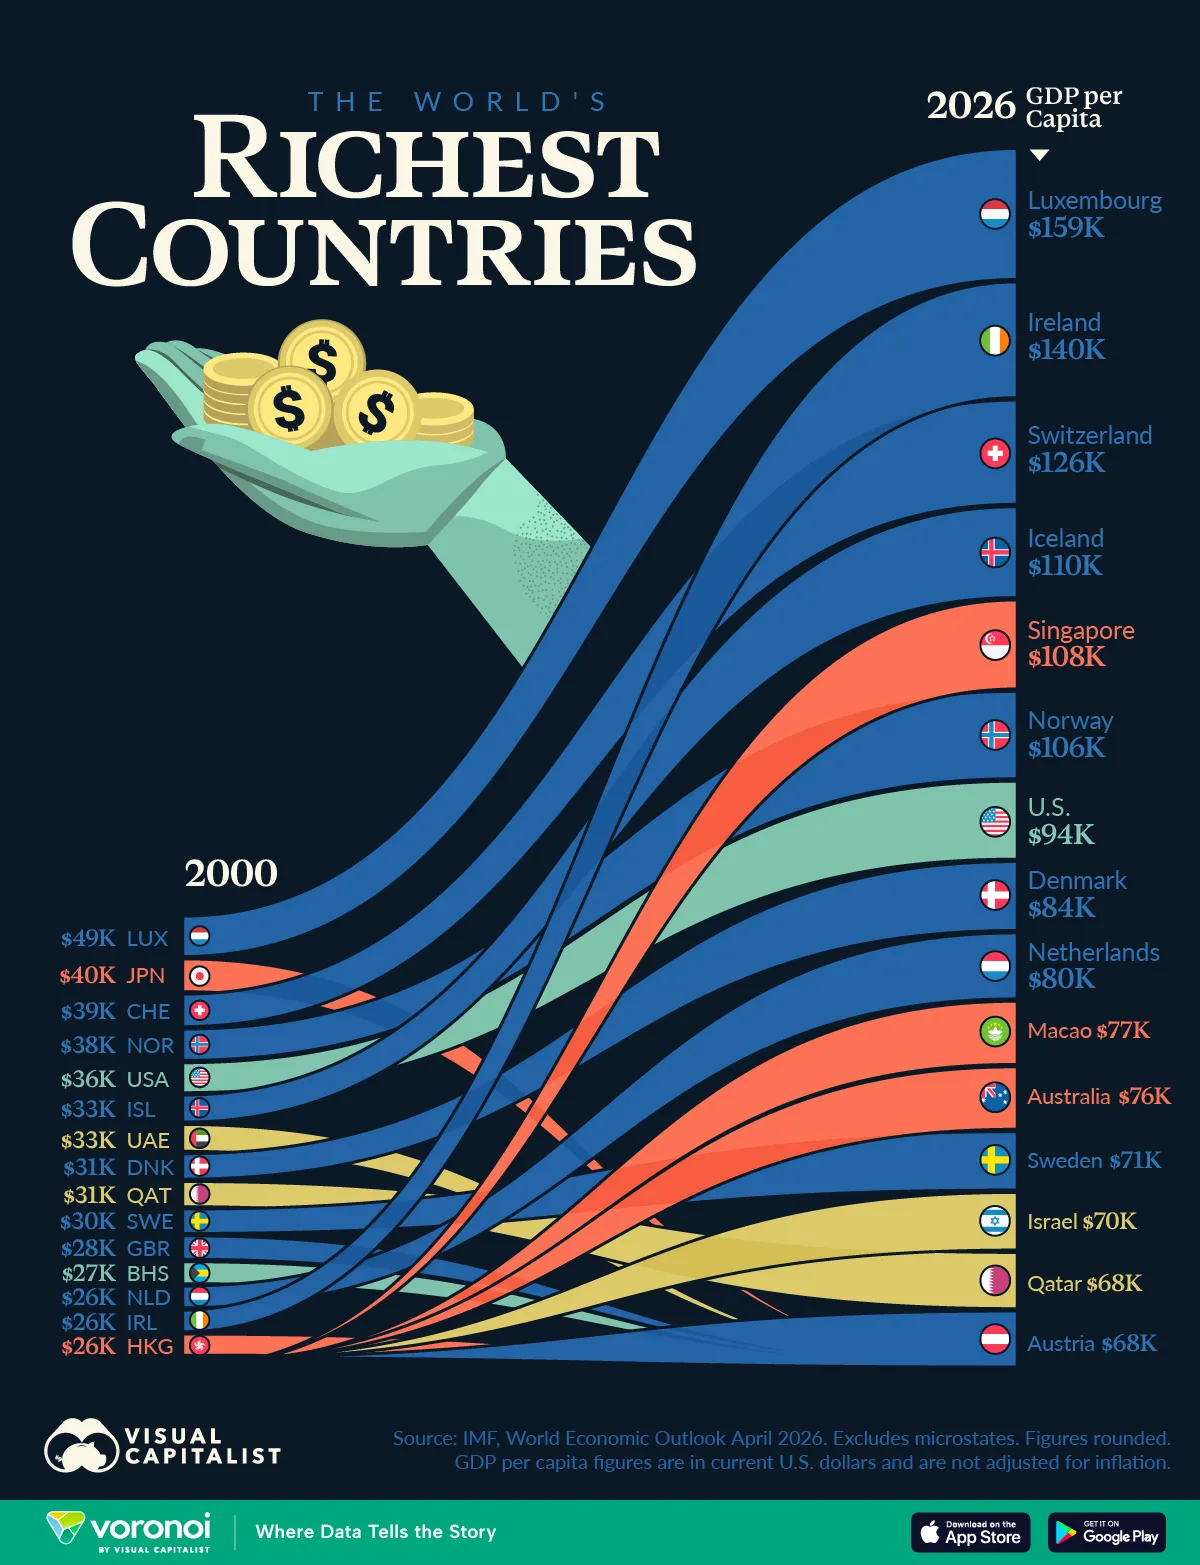
- Ireland rose from 14th to 2nd place since 2000, with GDP per capita climbing above $140,000.
- Japan fell from #2 to #39, marking one of the sharpest declines among advanced economies.
- Nine of the world’s 15 richest countries in 2026 are located in Europe.
The world’s richest countries look very different than they did 25 years ago.
Ireland has climbed from 14th place to second, while Japan has fallen from #2 to #39 despite remaining the world’s fourth-largest economy. These shifts highlight how globalization, technology investment, demographics, and currency movements have reshaped economic prosperity over time.
Using data from the International Monetary Fund’s latest World Economic Outlook, this graphic compares GDP per capita across the world’s richest countries in 2000 and 2026. Figures are shown in current U.S. dollars and are not adjusted for inflation.
The Global Wealth Leaderboard in 2026
The table below compares the world’s richest countries in 2000 and 2026 based on nominal GDP per capita.
| Rank (2026) | Country | Region | GDP Per Capita 2000 ($, thousands, nominal) |
GDP Per Capita 2026 ($, thousands, nominal) |
|---|---|---|---|---|
| 1 |  Luxembourg Luxembourg |
Europe | 48.98 | 158.73 |
| 2 |  Ireland Ireland |
Europe | 26.19 | 140.19 |
| 3 |  Switzerland Switzerland |
Europe | 39.42 | 126.18 |
| 4 |  Iceland Iceland |
Europe | 32.75 | 110.05 |
| 5 |  Singapore Singapore |
Asia-Pacific | 23.85 | 107.76 |
| 6 |  Norway Norway |
Europe | 37.91 | 105.88 |
| 7 |  U.S. U.S. |
N. America | 36.31 | 94.43 |
| 8 |  Denmark Denmark |
Europe | 30.78 | 83.45 |
| 9 |  Netherlands Netherlands |
Europe | 26.34 | 79.92 |
| 10 |  Macao SAR* Macao SAR* |
Asia-Pacific | 15.72 | 76.45 |
| 11 |  Australia Australia |
Asia-Pacific | 20.95 | 75.65 |
| 12 |  Sweden Sweden |
Europe | 29.6 | 70.68 |
| 13 |  Israel Israel |
Middle East | 21.7 | 69.8 |
| 14 |  Qatar Qatar |
Middle East | 30.46 | 68.14 |
| 15 |  Austria Austria |
Europe | 24.5 | 67.76 |
Earliest available data for Macao SAR is from 2021.
Ireland’s Remarkable Rise
No country climbed the rankings faster than Ireland.
Its GDP per capita increased more than fivefold between 2000 and 2026, lifting it from 14th place to second globally. The country’s rise reflects decades of foreign investment from multinational technology, pharmaceutical, and financial firms that use Ireland as a European base.
Singapore also posted one of the largest gains, rising from 20th to fifth place. Like Ireland, the city-state benefited from its role as a global hub for finance, trade, and advanced industries.
Together, the two countries illustrate how smaller economies can rapidly climb the global wealth rankings by attracting investment and high-value industries.
How Japan Dropped From #2 to #39
Japan’s decline is one of the most striking shifts in the global rankings. In 2000, only Luxembourg had a higher GDP per capita. By 2026, Japan ranks 39th despite remaining one of the world’s largest economies by total output.
Japan ranked ahead of Switzerland, Norway, and Denmark in 2000. Today, all four rank dramatically higher. An aging population, shrinking workforce, decades of slow growth, and a weaker yen have all contributed to its decline in dollar-based GDP-per-capita rankings.
The result highlights the difference between economic size and economic output per person.
Europe Still Dominates the Wealth Rankings
Despite major shifts elsewhere, Europe remains the world’s leading concentration of high-income economies. Nine of the top 15 countries in the 2026 ranking are European, including Luxembourg, Ireland, Switzerland, Norway, Denmark, the Netherlands, Austria, Iceland, and Sweden.
Many of these nations combine highly productive industries with strong institutions, skilled workforces, and access to large regional markets through the European Union.
The rankings also reveal that economic prosperity is not solely determined by a country’s size. Most of the world’s richest economies have relatively small populations, allowing strong industries and high-value exports to translate into larger gains on a per-person basis.
Meanwhile, several of the world’s largest economies, including China, India, Brazil, and Indonesia, remain absent from the list despite their growing global influence.
Rich Countries Don’t Always Have Rich Citizens
The rankings measure economic output per person, not household wealth.
Countries such as Ireland and Luxembourg rank near the top because they generate enormous economic output relative to their populations. However, measures such as median wealth and disposable income often produce a somewhat different ranking.
That’s why economists use GDP per capita as one lens on prosperity rather than a complete picture.
The World’s Wealth Centers Keep Shifting
The rankings offer a reminder that economic leadership is far from permanent.
Twenty-five years ago, few observers would have predicted that Ireland would become richer per person than nearly every country on Earth, or that Japan would fall out of the world’s top tier.
What stands out most is not who ranks first today, but how dramatically the leaderboard has changed. The last quarter century shows that wealth is constantly being reshaped by innovation, investment, demographics, and policy, creating new winners while challenging long-established leaders.
Learn More on the Voronoi App 
To learn more about this topic, check out this graphic on where the world’s ultra-rich live in 2026.