Ranked: Top Countries by Annual Electricity Production
This was originally posted on our Voronoi app. Download the app for free on iOS or Android and discover incredible data-driven charts from a variety of trusted sources.
Key Takeaways
- China tops the list for electricity production in 2024.
- The world’s second-largest economy produced over 10,000 TWh of electricity.
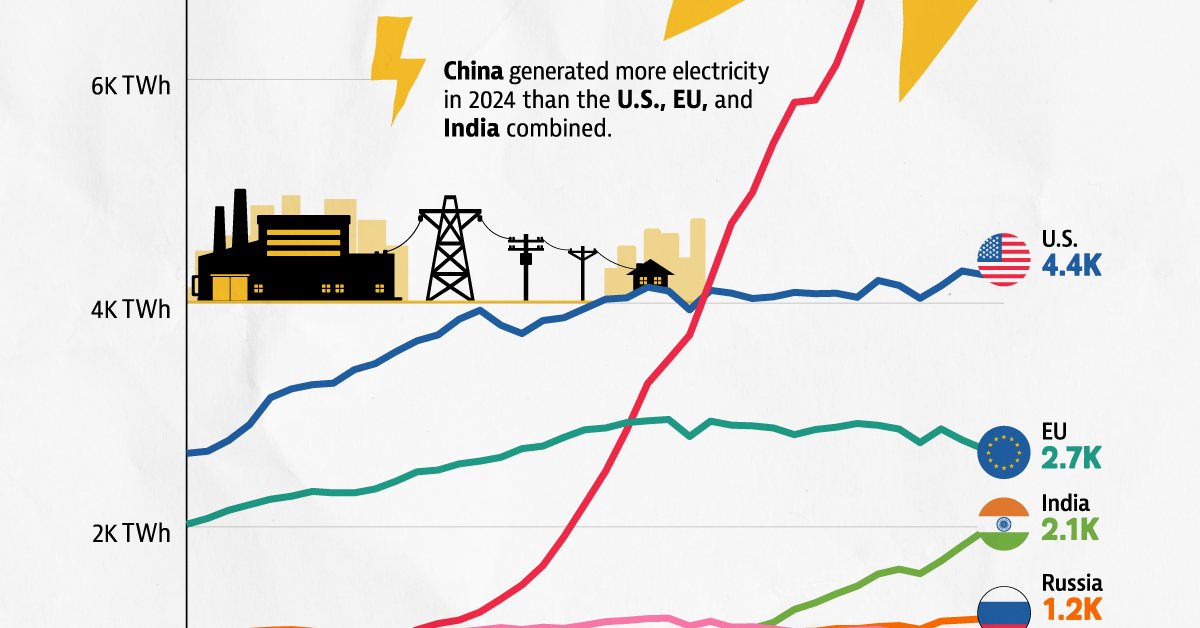
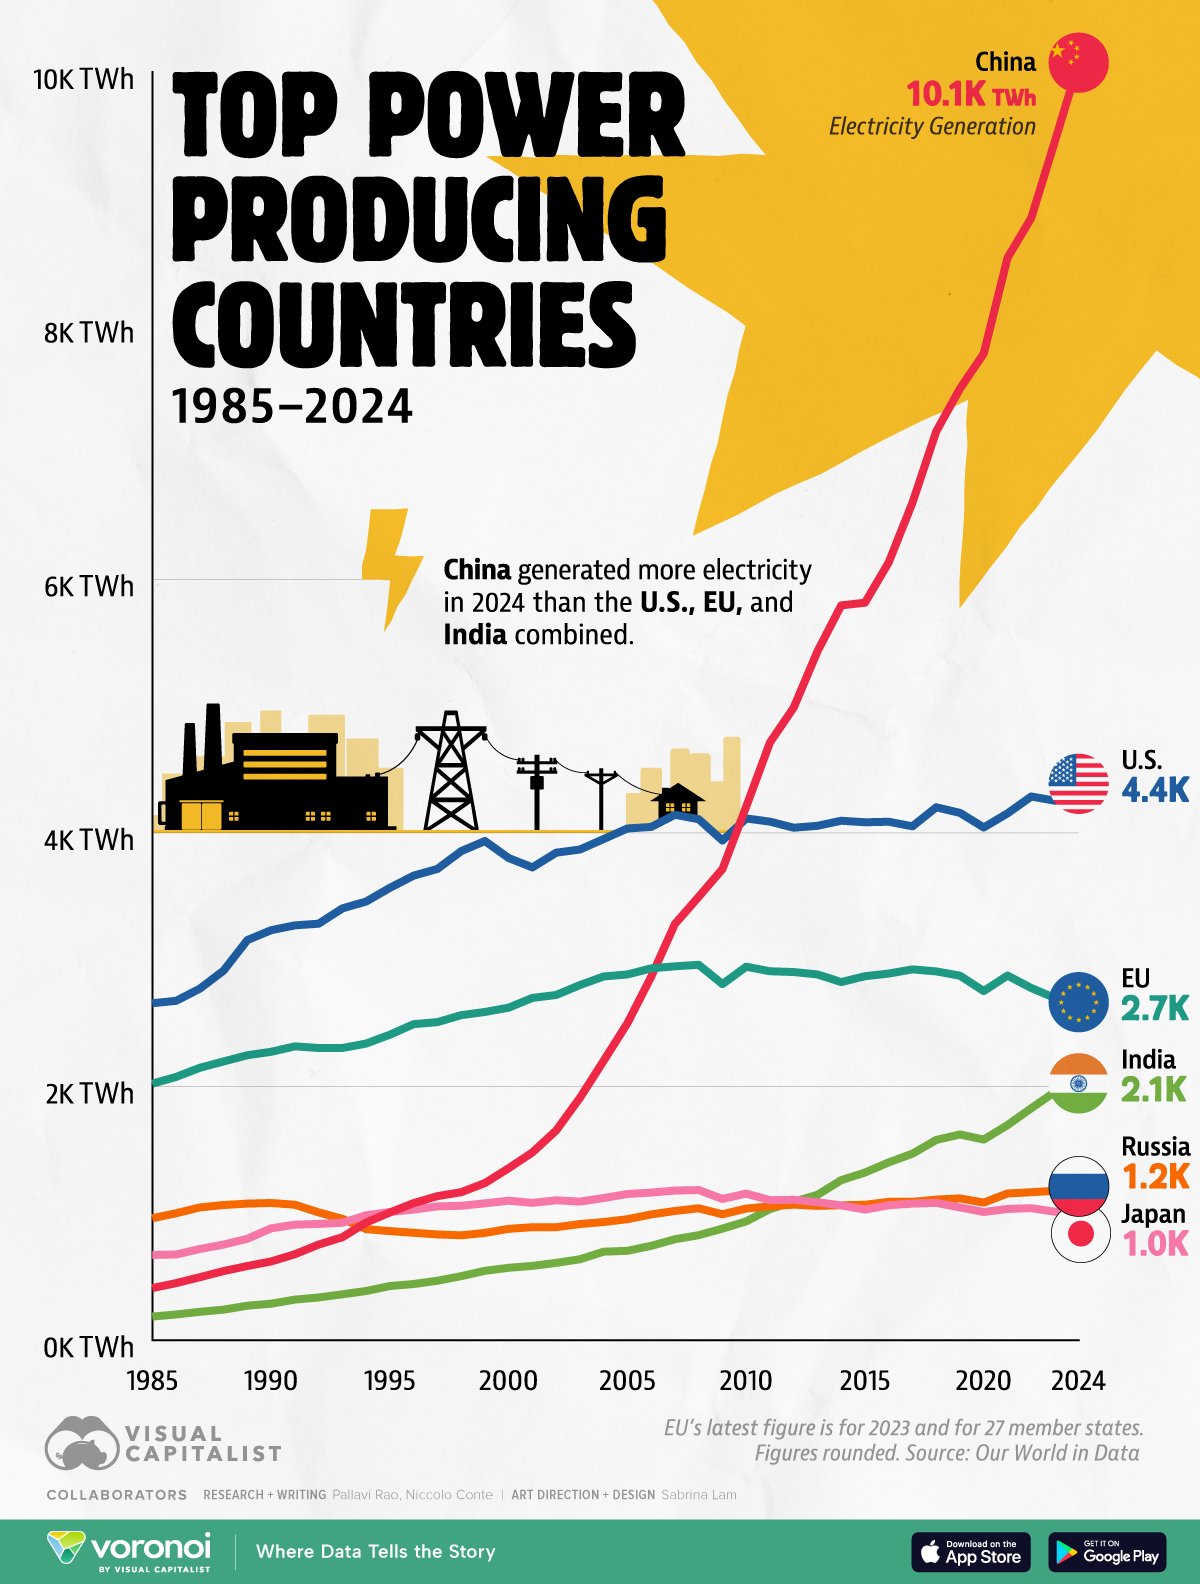
- That’s more than the combined output of the U.S., EU, and India—the next three biggest producers.
A light bulb is a symbol for innovation, ingenuity, and progress.
While it lends itself well as a visual metaphor for “bright idea,” the electricity powering it is also fundamental to the functioning of modern economies.
Which is why when we visualize the top countries by annual electricity production between 1985–2024, the world’s largest economies are the ones that show up on the chart.
Figures for this graphic are sourced from Our World in Data, measured in terawatt-hours (TWh)
Ranked: The Largest Electricity Producers in the World
China generated over 10,000 TWh of electricity in 2024.
For context, that’s more than the combined output of the U.S., EU, and India—the next three biggest producers.
| Year |  China (TWh) China (TWh) |
 U.S. U.S. |
 EU EU |
 India India |
 Russia Russia |
 Japan Japan |
|---|---|---|---|---|---|---|
| 1985 | 411 | 2,657 | 2,023 | 186 | 962 | 672 |
| 1986 | 450 | 2,676 | 2,076 | 203 | 1,001 | 676 |
| 1987 | 497 | 2,772 | 2,148 | 224 | 1,047 | 719 |
| 1988 | 545 | 2,914 | 2,198 | 241 | 1,066 | 754 |
| 1989 | 585 | 3,155 | 2,247 | 272 | 1,077 | 800 |
| 1990 | 621 | 3,233 | 2,274 | 288 | 1,082 | 882 |
| 1991 | 678 | 3,271 | 2,317 | 320 | 1,068 | 911 |
| 1992 | 754 | 3,284 | 2,304 | 337 | 1,008 | 917 |
| 1993 | 812 | 3,405 | 2,304 | 362 | 957 | 926 |
| 1994 | 928 | 3,459 | 2,339 | 388 | 876 | 985 |
| 1995 | 1,007 | 3,567 | 2,409 | 427 | 860 | 1,011 |
| 1996 | 1,081 | 3,663 | 2,492 | 443 | 847 | 1,030 |
| 1997 | 1,136 | 3,716 | 2,508 | 469 | 834 | 1,055 |
| 1998 | 1,167 | 3,856 | 2,563 | 505 | 827 | 1,060 |
| 1999 | 1,239 | 3,936 | 2,588 | 547 | 846 | 1,079 |
| 2000 | 1,356 | 3,802 | 2,622 | 571 | 878 | 1,100 |
| 2001 | 1,481 | 3,728 | 2,699 | 586 | 891 | 1,083 |
| 2002 | 1,654 | 3,844 | 2,722 | 610 | 891 | 1,103 |
| 2003 | 1,911 | 3,869 | 2,800 | 638 | 916 | 1,093 |
| 2004 | 2,203 | 3,952 | 2,868 | 698 | 932 | 1,121 |
| 2005 | 2,500 | 4,035 | 2,884 | 705 | 954 | 1,153 |
| 2006 | 2,866 | 4,047 | 2,932 | 744 | 992 | 1,164 |
| 2007 | 3,282 | 4,143 | 2,948 | 796 | 1,019 | 1,180 |
| 2008 | 3,496 | 4,108 | 2,960 | 828 | 1,040 | 1,184 |
| 2009 | 3,715 | 3,940 | 2,808 | 880 | 993 | 1,114 |
| 2010 | 4,207 | 4,114 | 2,945 | 937 | 1,038 | 1,156 |
| 2011 | 4,713 | 4,089 | 2,909 | 1,034 | 1,055 | 1,104 |
| 2012 | 4,988 | 4,041 | 2,903 | 1,092 | 1,069 | 1,107 |
| 2013 | 5,432 | 4,056 | 2,884 | 1,146 | 1,059 | 1,088 |
| 2014 | 5,794 | 4,096 | 2,824 | 1,262 | 1,064 | 1,063 |
| 2015 | 5,815 | 4,084 | 2,870 | 1,322 | 1,068 | 1,030 |
| 2016 | 6,133 | 4,088 | 2,891 | 1,402 | 1,091 | 1,064 |
| 2017 | 6,604 | 4,052 | 2,924 | 1,471 | 1,091 | 1,077 |
| 2018 | 7,166 | 4,202 | 2,908 | 1,579 | 1,109 | 1,083 |
| 2019 | 7,503 | 4,158 | 2,874 | 1,622 | 1,118 | 1,047 |
| 2020 | 7,779 | 4,043 | 2,753 | 1,582 | 1,085 | 1,011 |
| 2021 | 8,534 | 4,154 | 2,875 | 1,696 | 1,157 | 1,035 |
| 2022 | 8,849 | 4,287 | 2,777 | 1,829 | 1,167 | 1,041 |
| 2023 | 9,456 | 4,254 | 2,698 | 1,958 | 1,178 | 1,013 |
| 2024 | 10,073 | 4,387 | 2,698 | 2,058 | 1,211 | 1,022 |
Note: EU’s latest figure is from 2023.
China’s rapid rise in electricity generation fueled its equally rapid economic growth. In fact, research found that 1% increase in its electricity production corresponded to 0.17% increase in GDP (but not vice-versa).
However, in 2015 the Chinese government mandated a dual control policy to power generation. This meant reducing energy intensity by forcing shutdowns along with developing renewable sources to curb their emissions.
For reference, China also produces the most wind and solar energy in the world.
Why China Generates & Consumes More Electricity Than U.S.
If electricity generation (and consumption) correspond so closely to economic growth, then why is China still the second-largest economy in the world when it’s far outpaced the U.S. in power production?
The answer lies in how electricity is consumed in each country. Data from the IEA shows that industry is the primary consumer for China’s electricity.
| Country | Main Consumption Sector | Share of Total Electricity Use |
|---|---|---|
| China |
Industry | 59% |
| U.S. |
Residential | 38% |
Source: IEA: China’s electricity profile and the U.S. electricity profile.
On the other hand, America’s primary electricity consumers are residential homes.
A quick reminder that over the last two decades, manufacturing and heavy industries (with the exception of oil and gas production) have moved to China from the rest of the world, driving its extraordinary economic growth.
Meanwhile, the U.S. economy is powered by consumption of goods and high-value services, both which aren’t as energy-intensive as manufacturing.
Thus, China needs more to power itself because of its economic structure, and not only because it has more people.
Finally, the emergence of AI, and the demand for data centers means that U.S. electricity consumption (and generation), which has been steady for the last 20 years, is ticking up again.
Learn More on the Voronoi App 
This chart is best viewed with other data in context. Check out: Visualizing China’s 18.6 Trillion Economy by Sector to see how much industry contributes to the country’s GDP.
- Source: https://www.visualcapitalist.com/ranked-top-countries-by-annual-electricity-production-1985-2024/