Ranked: U.S. States vs. Countries by GDP per Capita
Key Takeaways:
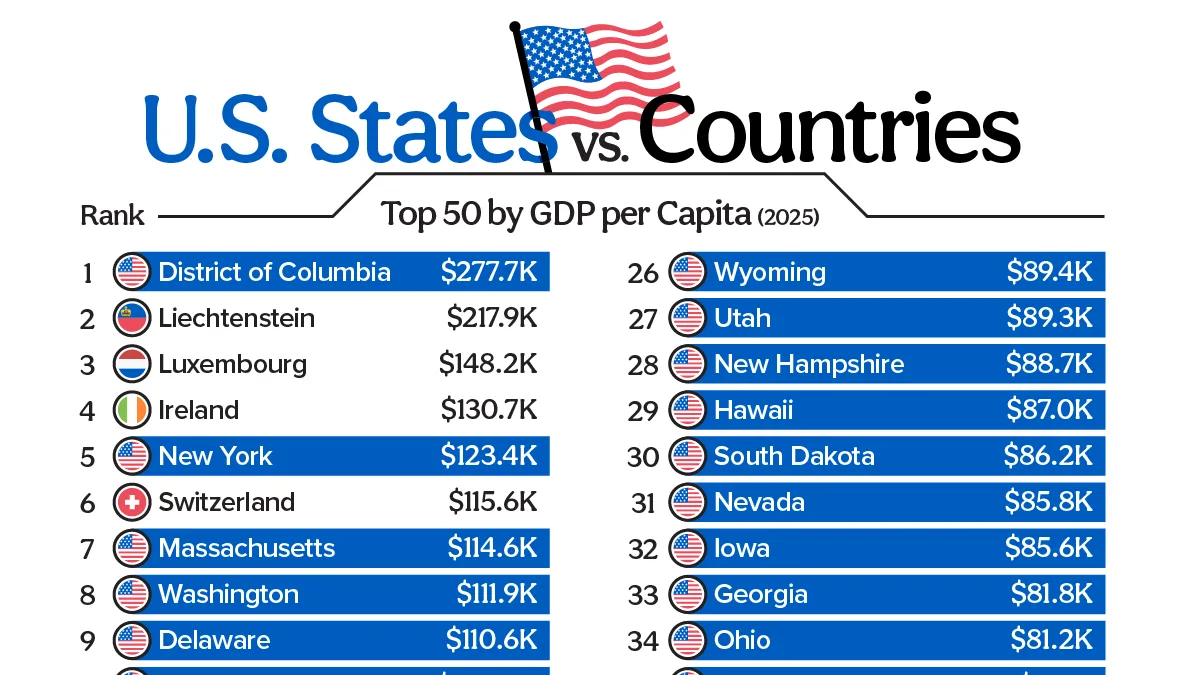
- Eight U.S. states rank among the top 15 economies shown.
- New York ranks fifth overall at $123,369 per person, ahead of Switzerland and every other U.S. state.
- The U.S. average is $89,991, ranking 24th among the states and countries shown.
GDP per capita divides an economy’s output by its population, providing a useful, though imperfect, measure of economic output per person.
This ranking combines 2025 nominal GDP per capita data from the IMF with state GDP data from the U.S. Bureau of Economic Analysis.
U.S. States Rival the World’s Richest Countries
The table below compares U.S. states and selected countries using IMF and BEA data, with figures expressed in current U.S. dollars.
| Rank | Country / State | Type | GDP per Capita (USD) |
|---|---|---|---|
| 1 |  District of Columbia District of Columbia |
U.S. Federal District | 277,689 |
| 2 |  Liechtenstein Liechtenstein |
Country | 217,928 |
| 3 |  Luxembourg Luxembourg |
Country | 148,247 |
| 4 |  Ireland Ireland |
Country | 130,652 |
| 5 | New York |
U.S. State | 123,369 |
| 6 |  Switzerland Switzerland |
Country | 115,620 |
| 7 | Massachusetts |
U.S. State | 114,635 |
| 8 | Washington |
U.S. State | 111,860 |
| 9 | Delaware |
U.S. State | 110,588 |
| 10 | California |
U.S. State | 108,012 |
| 11 | North Dakota |
U.S. State | 102,436 |
| 12 | Connecticut |
U.S. State | 102,062 |
| 13 | Alaska |
U.S. State | 101,742 |
| 14 |  Singapore Singapore |
Country | 99,365 |
| 15 |  Iceland Iceland |
Country | 99,071 |
| 16 | Nebraska |
U.S. State | 98,153 |
| 17 | Colorado |
U.S. State | 97,184 |
| 18 | Illinois |
U.S. State | 94,503 |
| 19 |  Norway Norway |
Country | 94,468 |
| 20 | New Jersey |
U.S. State | 92,915 |
| 21 | Texas |
U.S. State | 91,594 |
| 22 | Minnesota |
U.S. State | 91,154 |
| 23 | Maryland |
U.S. State | 90,680 |
| 24 | United States |
Country | 89,991 |
| 25 | Virginia |
U.S. State | 89,914 |
| 26 | Wyoming |
U.S. State | 89,379 |
| 27 | Utah |
U.S. State | 89,286 |
| 28 | New Hampshire |
U.S. State | 88,688 |
| 29 | Hawaii |
U.S. State | 86,967 |
| 30 | South Dakota |
U.S. State | 86,248 |
| 31 | Nevada |
U.S. State | 85,752 |
| 32 | Iowa |
U.S. State | 85,570 |
| 33 | Georgia |
U.S. State | 81,823 |
| 34 | Ohio |
U.S. State | 81,239 |
| 35 | Kansas |
U.S. State | 81,075 |
| 36 | Pennsylvania |
U.S. State | 80,895 |
| 37 | Tennessee |
U.S. State | 80,630 |
| 38 | Oregon |
U.S. State | 80,225 |
| 39 | North Carolina |
U.S. State | 79,815 |
| 40 | Wisconsin |
U.S. State | 79,199 |
| 41 | Arizona |
U.S. State | 78,463 |
| 42 | Florida |
U.S. State | 78,195 |
| 43 | Indiana |
U.S. State | 78,188 |
| 44 |  Denmark Denmark |
Country | 77,046 |
| 45 | Rhode Island |
U.S. State | 75,329 |
| 46 | Vermont |
U.S. State | 75,001 |
| 47 | Missouri |
U.S. State | 74,710 |
| 48 |  Netherlands Netherlands |
Country | 73,833 |
| 49 | Louisiana |
U.S. State | 73,639 |
| 50 | Maine |
U.S. State | 72,688 |
| 51 | Michigan |
U.S. State | 72,085 |
Washington, D.C. leads the ranking at $277,689 per person, ahead of Liechtenstein at $217,928. Massachusetts ($114,635) sits just below Switzerland, while California ($108,012) ranks ahead of Singapore and Iceland.
GDP measures the value of goods and services produced within an economy. On a per capita basis, differences can reflect productivity, workforce and industry composition, and resource endowments, rather than household wealth or living standards.
These factors help explain why GDP per person varies so widely internationally and why some of the richest countries often have highly productive, specialized economies.
How American States Compare
The scale and diversity of the U.S. economy allow individual states to develop highly productive industry clusters. Finance and professional services are important in New York, technology plays a major role on the West Coast, and energy production supports output in several resource-rich states.
Altogether, 13 U.S. states plus Washington, D.C. rank above the national figure of $89,991. Even Maine, ranked 50th in the graphic at $72,688, sits relatively close to the Netherlands at $73,833.
Still, GDP per capita should not be interpreted as average income. It measures production rather than how that output is distributed among residents. Fiscal structures also differ significantly between economies, as illustrated by our look at tax revenue as a share of GDP.
Learn More on the Voronoi App
For another perspective on America’s economic footprint, see America’s $3.4T in Imports Equal to 12% of GDP on the Voronoi app.